I would fund the IoT pilot that can turn a measured production loss into a verified P&L gain. Choose 1 process, name 1 decision owner, and set acceptance thresholds before installation. Compare the 4 use cases on data readiness, response time, integration work, total cost, and rollout risk.
- Machine monitoring: Find downtime and bottlenecks using equipment-state data. Existing PLC signals can reduce retrofit costs.
- Quality checks: Target scrap, rework, and defect escapes. Validate inspection accuracy and false rejects before automating rejection.
- Plant flow tracking: Reduce material searches and missed handoffs. Match barcode, RFID, BLE, UWB, or GPS to the location precision your process needs.
- Maintenance alerts: Turn condition changes into repair decisions. Use predictive models only when sensor data and repair records support them.
Quick Comparison
| Use case | Main cost drivers | Pilot fit |
|---|---|---|
| Machine monitoring | Machine interfaces, retrofits, networking | Downtime losses with usable equipment data |
| Quality checks | Inspection hardware, calibration, traceability | Frequent, measurable defects |
| Plant flow tracking | Tags, reader coverage, system links | Material delays and missing WIP |
| Maintenance alerts | Sensors, work-order links, alert validation | Critical assets with known failure modes |
I would compare providers using the same scope and a 3- or 5-year cost model, including internal labor, installation downtime, cybersecurity, training, and support. For context, the article cites $35,000-$120,000 for a medium-speed vision station, plus annual maintenance and support of roughly 10%-15% of capital - planning ranges, not quotes.
<u>A dashboard is not a financial result.</u> Establish a baseline - typically 4-8 weeks when production conditions allow - and scale only after verifying the results, workflow use, data quality, and safety.
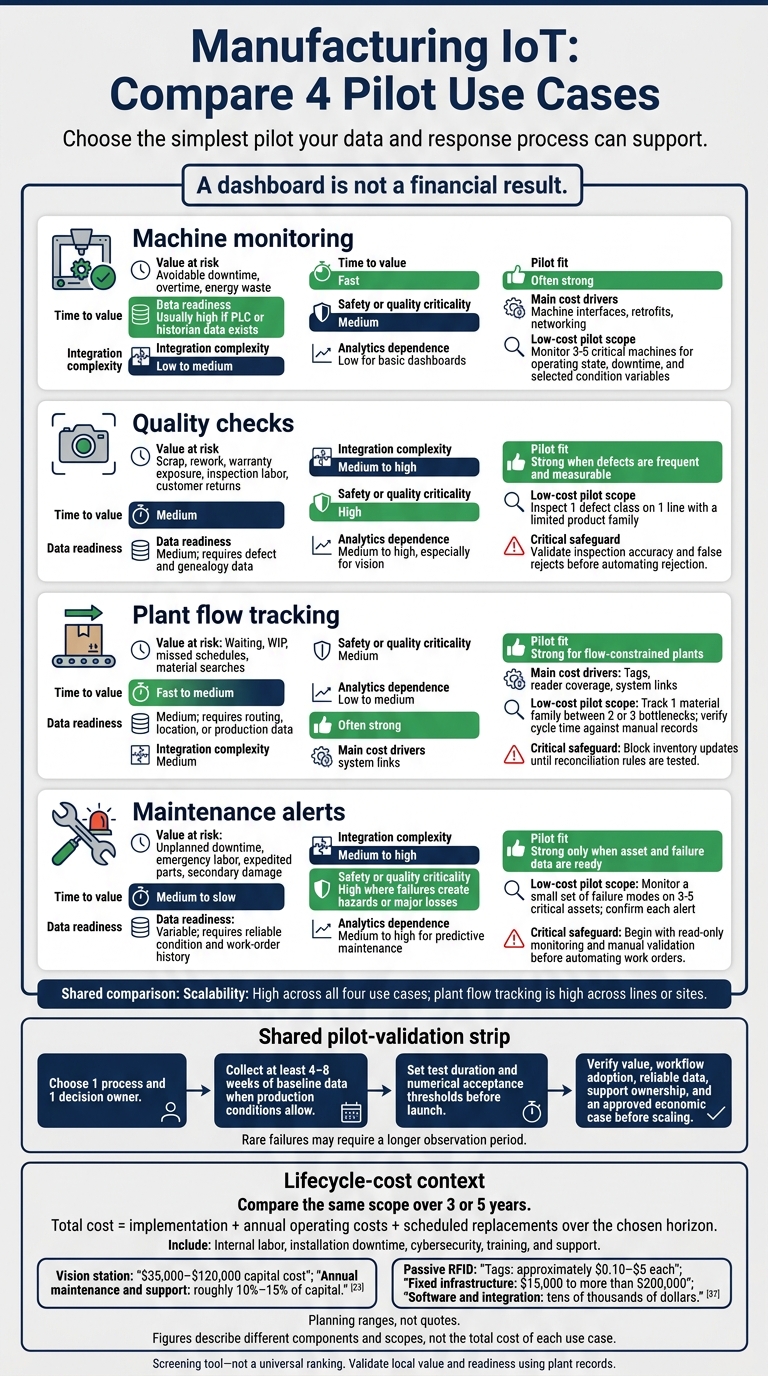
Manufacturing IoT: Compare 4 Pilot Use Cases
1. Machine Monitoring
Process Goals and Results
Equipment-state data shows where production time goes: running, idle, stopped, faulted, or changeover. Link those states to downtime and throughput so supervisors can adjust staffing, shift work between machines, and address bottlenecks. Cycle time measures time per unit; downtime records lost production time; throughput measures acceptable units per period.
OEE = Availability × Performance × Quality.[3][4][6] Compare OEE with the machine’s own baseline. Plant-to-plant comparisons require standardized downtime codes, ideal cycle times, and quality rules.[3][5][7]
Start with dashboards and loss analysis. Add anomaly detection, trend analysis, or failure-risk models only when condition data and failure history are reliable. Benchmark each machine against its own baseline and product mix, and track throughput per labor hour and scrap alongside OEE. These metrics support decisions only when the data path is clean.
Data and System Links
Validate production data before calculating OEE. Collect timestamped run/stop signals, cycle and part counts, alarm codes, work-order IDs, downtime reasons, and good/scrap counts using existing PLC or CNC signals.
MES supplies schedules and cycle standards; quality systems supply defect records; CMMS links stops to maintenance history. Add ERP only if the pilot needs order, inventory, or cost data.
Sync clocks, check counter resets, remove duplicate events, and reconcile automated counts with production and quality records. This work affects both cost and rollout risk.
Lifecycle Costs
Compare total lifecycle costs, not software price alone. Include installation, controls engineering, networking, subscriptions, integration, cybersecurity, training, and continued support.
Native machine signals reduce retrofit work. Older equipment may need sensors, gateways, protocol conversion, or manual entries. Condition monitoring adds sensor and sampling costs. Predictive analytics also requires historical-data preparation, model validation, and maintenance.
Production and Rollout Risks
Pilot a small group of representative bottleneck assets before expanding deployment. Validate downtime categories with operators: a stopped machine may lack material rather than need repair.
Test integrations without disrupting controls, segment industrial networks, limit access, and provide manual fallback procedures. Check data completeness and changes in recording practices before attributing better results to the equipment. Next, test whether the same signals can support quality checks.
sbb-itb-97f6a47
2. Quality Checks
Process Goals and Results
Quality checks locate defects; detection alone does not prevent them. Machine monitoring shows where time is lost, while inspection shows where defects begin. Select methods by defect type, accuracy, and line speed. Combine them when you need both early process-drift signals and final defect confirmation. Response time must fit line constraints.
Process sensors track temperature, pressure, torque, or flow to flag drift before it produces scrap. In-line gauges measure dimensions, weight, or fill level during production. Machine vision checks visible features, labels, and assembly completeness.
Focus first on 1 high-cost defect class. Track its scrap, rework, escapes, and inspection time. Measure detection sensitivity and false rejects separately, by defect class, rather than relying on overall accuracy. To assess prevention, check whether alarms give operators enough time to correct the process before defective parts are produced.
Data and System Links
Every inspection result needs a traceable production record. Link each reading or image to the unit or lot, machine, recipe version, timestamp, measurement, and disposition.[9] Connect validated results to the PLC for reject/divert actions, MES for unit history, and the quality-management system for containment and corrective action.[10][11]
Keep confirmed inspector calls as reference labels. For AI vision, include representative images of confirmed defects and normal production variation.[9]
Lifecycle Costs
Compare the costs of calibration, controls engineering, gauge fixtures, repeatability testing, lighting, image labeling, and model upkeep. A published estimate puts a medium-speed vision station at $35,000-$120,000 in capital cost, with annual maintenance and support at roughly 10%-15% of capital.[8] Use this as a planning range, not a quote.
Calculate value from avoided scrap, rework, and escapes, less added reinspection and upkeep.
Production and Rollout Risks
Validate the measurement before automating reject/divert actions. Use gauge R&R for dimensional checks and trusted reference inspections for vision. Test across shifts, product variants, changeovers, and changes in production conditions.
Confirm that the reject mechanism can keep pace with production. Route uncertain results to manual review or quarantine, and define safe behavior when inspection fails. Excessive false rejects erase savings and encourage operators to bypass inspection.
3. Plant Flow Tracking
Process Goals and Results
Track the process problem, not the asset. Start with misplaced material, unknown WIP locations, tool search time, yard congestion, missed handoffs, or inaccurate inventory records. Measure baseline search time, WIP dwell time, inventory accuracy, and line stoppages caused by missing material.
Missed handoffs and stale inventory records cause downtime, not just data errors. Flow tracking connects physical movement to system records. Choose the simplest technology that supports the decision.
| Technology | Best fit | Main limitation |
|---|---|---|
| Barcode or QR code | Confirm material and WIP handoffs | Requires line of sight and disciplined scanning |
| Passive RFID | Automatically identify tagged totes, pallets, and WIP at portals or chokepoints | Metal, liquids, tag orientation, reader placement, and interference can affect reads |
| Bluetooth Low Energy (BLE) | Locate tools, carts, and mobile assets by zone | Typical accuracy is measured in meters, not centimeters[14] |
| Ultra-wideband (UWB) | Find high-value tools or distinguish adjacent staging lanes | Roughly 10–30 centimeters of accuracy in suitable deployments; requires active tags, anchors, installation, and regular calibration[13][14] |
| Outdoor GPS | Track trucks, trailers, and yard vehicles | Generally unsuitable for reliable indoor positioning[14] |
Data and System Links
Give every handoff an owner, along with an origin, destination, and event. Receiving confirms inbound material; material handling owns replenishment moves; production owns WIP moves; maintenance owns tool custody; logistics owns yard movements.
Record the asset or container ID, event type, timestamp, location, quantity, status, and scanner or reader. For WIP, add the work order and routing step. Link events to ERP inventory, MES operations, WMS bins, and maintenance or EAM tool records so movement data stays aligned with production, inventory, and tool ownership. Display confirmed reads separately from inferred locations.
Lifecycle Costs
Budget for infrastructure and integration, not just tags. One published comparison puts passive RFID tags at approximately $0.10–$5 each, fixed infrastructure at $15,000 to more than $200,000, and software and integration in the tens of thousands of dollars.[12] Treat these as planning ranges, not quotes.
Include active-tag battery changes, replacement labels, calibration, subscriptions, training, and layout changes in the budget.
Production and Rollout Risks
Confirm a current site map, network coverage, and mounting points before installation. Test under peak operating conditions. An empty-floor test won't expose reflections, stacked metal, forklifts, or production interference. Authenticate readers and gateways, segment their network, and control vendor access.[15] Keep manual fallback procedures and assign an exception owner to missed, duplicate, or uncertain events.
Pilot 1 flow with 1 asset class. Set acceptance thresholds for read success rate, event latency, search time, and inventory accuracy before go-live. Run the pilot through normal cycles, shift changes, and peak traffic. Block inventory updates until reconciliation rules are tested.
The same event data can trigger maintenance alerts when delays, misroutes, or repeated exceptions point to equipment trouble.
4. Maintenance Alerts
Process Goals and Results
Maintenance alerts must trigger action, not just display information. Use preventive maintenance for predictable wear, condition-based triggers for measurable deterioration, and predictive models only for critical assets with enough failure history.
Each alert should lead to a decision: keep monitoring, inspect, repair, derate, or stop the asset. Measure results against a pre-pilot baseline using unplanned downtime, emergency work orders, maintenance cost per operating hour, and lead time. Track false alarms and missed failures alongside prediction accuracy.
Data and System Links
Link each alert to a verified repair. Check operating state and sensor health, then create or update the CMMS/EAM work order according to safety and production priority. Include the asset ID, timestamp, signal trend, severity, and recommended action.
MES context helps separate startup behavior from deterioration, while ERP links support parts availability. Plan labor, permits, tools, and the production window before work begins. Close the order with failure codes, findings, parts, labor, downtime, and a post-repair test. Use those records to refine alert rules.
Lifecycle Costs
Budget for sensors, calibration, asset-record cleanup, CMMS/EAM integration, cybersecurity, and training. Recurring costs cover alert validation, sensor replacement, support, and model tuning. These expenses support alert quality, sensor upkeep, and work-order accuracy.
The U.S. Department of Energy reports potential 8%-12% savings over preventive maintenance alone for a working predictive-maintenance program. Treat this as a benchmark, not a plant-level guarantee.[16] Build the business case in U.S. dollars around avoided production loss and emergency work, minus implementation and recurring costs.
Production and Rollout Risks
Pilot 1 critical asset class and 1 measurable failure mode. Confirm consistent asset records, calibrated sensors, sufficient sampling frequency, and a named maintenance owner for each alert type. Set thresholds by speed, load, and operating state rather than applying 1 limit to every condition.
Begin with read-only monitoring and manual validation before automating work orders. Suppress duplicate alerts, check technician and parts availability, and require safety approval before alerts trigger disruptive actions. Advance the pilot only when lead time allows a practical repair and completed work orders show useful, verified outcomes.
Keep asset IDs, sensor data, and work orders aligned throughout the pilot through clean inputs, system links, and disciplined records.
Data and Integration Requirements
Data Inputs and System Links
Define the decision before choosing system connections. Match each use case to its minimum data inputs, system links, and required response time. Map the data path first, then choose the simplest integration that supports the decision.
Use this matrix as a deployment checklist for the 4 use cases.
| Use case | Minimum data inputs | Core system links | Latency and retention | Integration demands | Owner |
|---|---|---|---|---|---|
| Machine monitoring | Equipment ID, timestamp, state, selected tags, product, shift, or work order | PLC/sensors, gateway as needed, asset registry, dashboard/historian | Seconds to minutes for dashboards and alarms; weeks to months for baseline analysis | Tag mapping, state definitions, equipment-ID alignment | Operations: machine-state definitions |
| Quality checks | Unit/lot ID, result, measurement, limits, timestamp, station/device ID; images or defect classifications when used | Inspection device/interface, quality database, MES/traceability; PLC for automated rejects | Within the reject/segregation window; retention based on product/lot requirements | Unit-to-result matching, release/disposition workflow | Quality: specifications and release |
| Plant flow tracking | Asset/container/WIP ID, location/event, timestamp, source/destination, status | Capture source, identifier registry, tracking application; MES/WMS/ERP where records change | Seconds to minutes for visibility; routing-cycle latency for automation; history for dwell and genealogy analysis | Read-zone mapping, duplicate filtering, movement validation | Operations: movement and status |
| Maintenance alerts | Asset ID, condition signal, alarm state, runtime, maintenance history, work-order status | Sensors/PLC, asset registry, alert logic, CMMS/EAM for work creation | Seconds to minutes for critical alerts; hours for slow changes; multiple maintenance cycles for prediction | Signal-to-asset mapping, repair-history linkage | Maintenance: asset and work records |
Sampling frequency is not latency. Sample based on how fast the physical condition changes. Deliver data based on how soon someone must act. Slow temperature changes can be sampled every minute; vibration may require high-frequency edge capture. Keep millisecond closed-loop control in the control system.
Preserve event time, ingestion time, time zone, units, and quality status. Synchronize clocks and maintain 1 cross-reference between PLC tags, MES equipment IDs, and enterprise asset numbers.
Once the data model is clear, choose the lowest-cost capture method that meets the latency and accuracy targets.
| Method | Data needs | Infrastructure | Integration demands | Main limitation |
|---|---|---|---|---|
| Manual inspection | Result, specification, unit/lot ID, timestamp, reason code | Workstation/tablet or paper-to-digital workflow | QMS/MES entry, operator authentication, approvals | Operator variation, limited sampling, missing records |
| Sensor-based inspection | Calibrated value, units, limits, unit/lot ID, timestamp, device status | Sensors, signal conditioning, PLC/gateway, calibration | PLC/SCADA to MES/QMS and traceability | Unmeasured defects, drift, fouling, noise, placement |
| Machine vision | Images, camera/lighting settings, rule/model version, defect class, confidence, unit ID | Camera, controlled lighting, edge compute, image storage, model management | PLC reject link, MES/QMS results, unit traceability | Lighting/orientation changes, contamination, model drift, false rejects, storage volume |
| Barcode tracking | Encoded ID, scan location, timestamp | Labels, scanners, network, defined scan points | Scan-event mapping to WMS/MES/ERP | Line of sight; missed scans |
| RFID tracking | Tag ID, reader ID, timestamp, read zone | Tags, readers, antennas, middleware | Validated reads to MES/WMS/ERP and genealogy | Metal, liquids, orientation, reader placement |
| Bluetooth Low Energy tracking | Tag/receiver IDs, signal strength, timestamp | Tags, receivers, gateways, location software | Location mapping to tracking, MES/WMS, or maintenance records | Radio-dependent accuracy; limited precision |
| Ultra-wideband tracking | Tag/anchor IDs, timestamp, coordinates | Tags, anchors, gateways, calibrated map, positioning engine | Coordinate mapping to MES/WMS or fleet systems | Infrastructure cost, calibration, coverage, interference |
| Preventive maintenance | Asset hierarchy, calendar/runtime, intervals, completed work | CMMS/EAM, reliable asset and schedule records | Production calendar, runtime, parts, labor | Unnecessary work or failures before scheduled service |
| Condition-based maintenance | Condition value, threshold, asset ID, timestamp, alarm rules | Sensors/PLC, gateway, historian, alert engine | CMMS/EAM work creation; SCADA/MES operating context | Invalid thresholds and nuisance alerts |
| Predictive maintenance | Sensor history, operating context, failure labels, repair history, asset IDs | Historian/data platform, analytics, model monitoring | CMMS/EAM and MES; quality or ERP data as needed | Sparse failures, process changes, repeated model validation |
Data Quality and Cybersecurity
Connected equipment does not guarantee usable data. For legacy retrofits, document source tags, units, conversions, and destination fields. Before production use, check for missing records, values outside plausible ranges, calibration issues, clock misalignment, and mismatched identifiers.
Retain inspection evidence and rule versions for investigations. Keep maintenance history across the relevant cycles. Process owners approve data definitions; IT owns the platform and access controls.
Separate analytics traffic from safety and machine-control paths. Use network segmentation, role-based access, secure device provisioning, and coordinated patching instead of exposing equipment directly to enterprise applications. OT and IT must approve connections, maintenance windows, and recovery procedures in advance.
Before enabling automated actions, verify that the system cannot treat stale, duplicated, delayed, or invalid readings as current observations. Keep source and transformation records, define how the system behaves when connectivity is lost, and require the responsible process owner to approve data checks and action rules.
Lifecycle Costs and Rollout Risks
Lifecycle Costs
Compare the 4 pilots on total cost and rollout friction, not sensor prices. Once the data path is defined, build a site-specific 3- or 5-year total cost of ownership model that includes one-time and annual costs.
Require every vendor to quote the same scope: asset quantities, equipment specifications, integration endpoints, labor hours, and recurring services. Include internal engineering time and production lost during installation alongside vendor invoices.
| Use case | Hardware and installation | Software and integration | Data, analytics, and recurring costs | Main escalation drivers | Low-cost pilot scope |
|---|---|---|---|---|---|
| Machine monitoring | Sensor points, retrofits, and network work | Equipment-interface complexity | Sampling, storage, calibration, and support | Machine age and diversity, sensor density, and network coverage | Monitor 3-5 critical machines for operating state, downtime, and selected condition variables |
| Quality checks | Inspection-station hardware and setup | Traceability and product configuration | Image storage, labeling, and model upkeep | Line speed, product variation, lighting, and false-reject tolerance | Inspect 1 defect class on 1 line with a limited product family |
| Plant flow tracking | Reader coverage and tag infrastructure | Movement-record integration | Tag replacement, batteries, and support | Facility size, interference, location accuracy, and process steps | Track 1 material family between 2 or 3 bottlenecks; verify cycle time against manual records |
| Maintenance alerts | Condition-sensing and installation requirements | Platform and work-order integration | Subscriptions, model updates, calibration, and alert validation | Failure-mode diversity, repair-history quality, and integration depth | Monitor a small set of failure modes on 3-5 critical assets; confirm each alert |
Budget cybersecurity in both implementation and annual operating costs. Include hardening, testing, updates, support, and training.[17][18][19]
Calculate total cost as implementation + annual operating costs + scheduled replacements over the chosen horizon. Show costs by year when subscriptions, storage, or staffing will grow. For maintenance, value failures using lost production, emergency labor, expedited parts, and quality losses. Count time saved as cash only when it reduces overtime, contractor spend, or headcount.
Production and Rollout Risks
Low cost alone does not justify rollout. The pilot must pass safety, data, and operations gates before expansion.
Set acceptance gates before installation, and reserve production windows for electrical work, lockout/tagout, commissioning, and validation. Give each gate a measurable target, a review period, and a named approver. Stop expansion while any safety or cybersecurity issue remains unresolved.
| Decision trigger | Mitigation | Accountable owner | Pilot acceptance gate |
|---|---|---|---|
| Unreliable data | Validate against reference records | Controls lead | Data accuracy, completeness, and uptime targets met |
| Unvalidated decisions | Test representative operating conditions | Process owner | Detection and false-alarm targets met |
| Unsafe automated actions | Validate interlocks and fault responses | Safety lead | Safety approval and fail-safe testing completed |
| Unclear response ownership | Define exception and closure rules | Operations lead | Every alert or exception has an owner and verified resolution |
| Unsupported devices | Require inventory and lifecycle support plans | OT cybersecurity lead | Every device approved, monitored, and supported |
| Unproven value or site readiness | Review outcomes, adoption, costs, and deployment friction | Executive sponsor | Predefined technical, operational, financial, and security criteria met |
The advisor defines requirements, builds the business case, evaluates vendors, coordinates integration and cybersecurity, and measures benefits. The IoT vendor supplies and supports its technology. Plant and safety teams retain approval authority.
Decoding IoT in Manufacturing: Impact, Adoption Barriers, and Use Cases
Conclusion: Choose a Pilot by Value and Readiness
Choose the pilot with the fastest supportable value, based on data readiness, cost, and rollout risk.
Set pilot weights before vendor demos. Rank value, feasibility, time to impact, scalability, and change burden. Score each criterion from 1–5, then calculate Σ(score × weight). Reverse-score friction: less integration work, less analytics dependence, and less disruption should earn higher scores.
Use this matrix to compare pilot fit, not theoretical best practice.
| Use case | Value at risk | Time to value | Data readiness | Integration complexity | Safety or quality criticality | Scalability | Analytics dependence | Pilot fit |
|---|---|---|---|---|---|---|---|---|
| Machine monitoring | Avoidable downtime, overtime, energy waste | Fast | Usually high if PLC or historian data exists | Low to medium | Medium | High | Low for basic dashboards | Often strong |
| Quality checks | Scrap, rework, warranty exposure, inspection labor, customer returns | Medium | Medium; requires defect and genealogy data | Medium to high | High | High | Medium to high, especially for vision | Strong when defects are frequent and measurable |
| Plant flow tracking | Waiting, WIP, missed schedules, material searches | Fast to medium | Medium; requires routing, location, or production data | Medium | Medium | High across lines or sites | Low to medium | Strong for flow-constrained plants |
| Maintenance alerts | Unplanned downtime, emergency labor, expedited parts, secondary damage | Medium to slow | Variable; requires reliable condition and work-order history | Medium to high | High where failures create hazards or major losses | High | Medium to high for predictive maintenance | Strong only when asset and failure data are ready |
This is a screening tool, not a universal ranking. Score local value and readiness using plant records. Choose the simplest use case your current data and response process can support.
Limit the pilot to 1 process and 1 decision owner. When production conditions allow, collect at least 4–8 weeks of baseline data. Segment it by line, asset, product family, shift, and operating mode where those factors affect performance. Assign owners across operations, quality, maintenance, IT/OT, cybersecurity, and finance.
Set the test duration and numerical acceptance thresholds before launch. Match metrics to the problem: downtime, scrap, WIP delays, inspection escapes and false rejects, or actionable alert precision. The pilot must produce a decision, not just a dashboard or model.
Scale only after documenting value, workflow adoption, reliable data, support ownership, and an approved economic case. Rare failures may require a longer observation period. Tie every performance claim to its cited source, asset population, operating conditions, and measured baseline.
FAQs
How do I separate IoT savings from normal production changes?
Set performance baselines before implementation, then track changes against measurable goals. Include all costs - technology, integration, training, and change management - and use break-even analysis to assess ROI. Business intelligence dashboards combine real-time IoT and ERP data to show where performance is changing.
For help selecting advisors to set benchmarks and manage your rollout, consult the Top Consulting Firms Directory.
Can I pilot IoT without replacing legacy equipment?
Existing machinery can connect to digital systems without a full system overhaul. APIs and IoT sensors support real-time data collection while keeping current infrastructure intact. Use a small pilot in a specific area to test compatibility and refine processes before expanding the rollout.
For phased implementations or complex integrations, Top Consulting Firms Directory provides resources to help select specialists and shortlist partners.
How do I avoid vendor lock-in when scaling IoT?
Prioritize open-source tools and modular architectures that support standard protocols such as REST or SOAP [1][2]. Tools such as Airbyte provide flexibility and reduce dependence on a single provider’s proprietary ecosystem [2]. Select integration platforms with extensibility and thorough documentation so systems can change as business needs evolve [1].