Most digital transformation projects fail to deliver real business results. Why? Many organizations focus on deadlines and budgets rather than measurable outcomes like customer satisfaction or revenue growth. Here’s how to fix that: track the right governance metrics.
Key Metrics for Success:
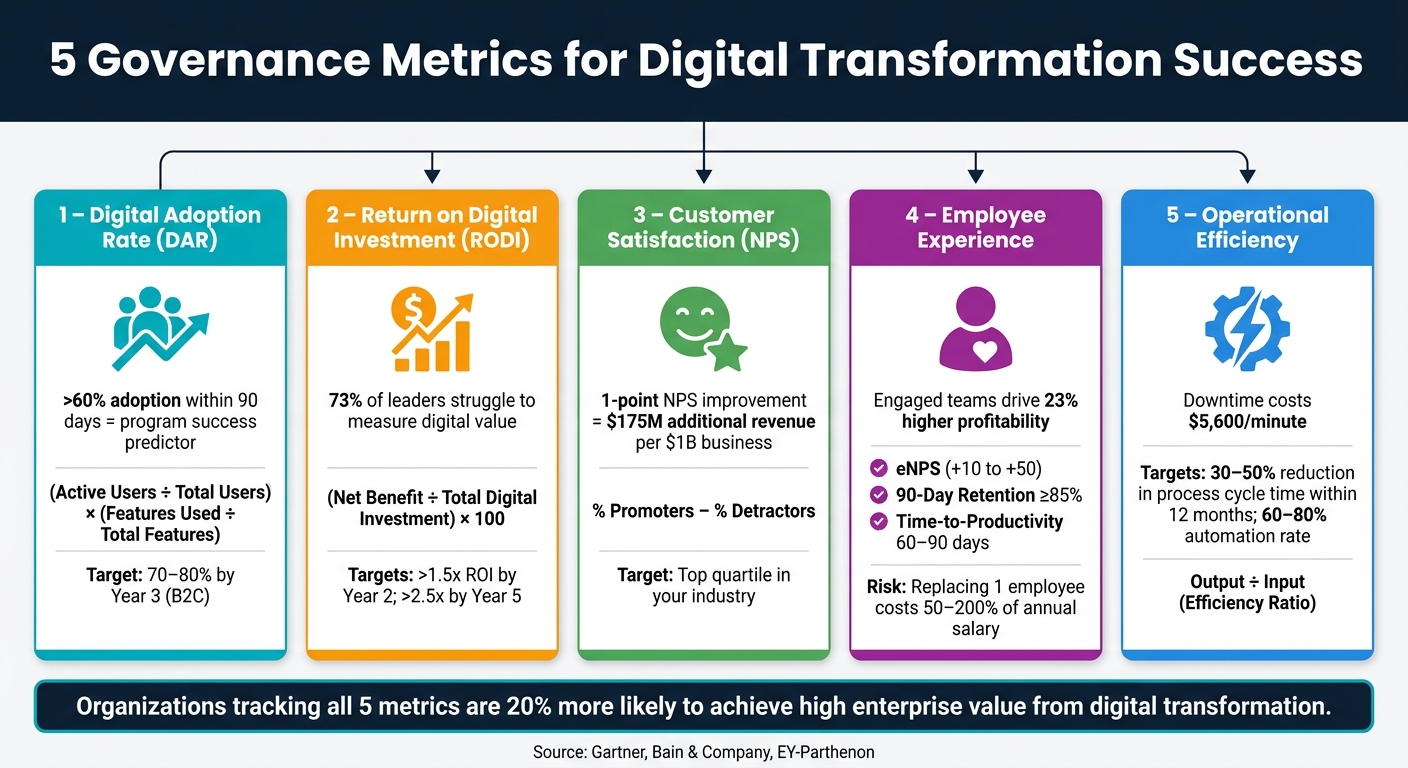
- Digital Adoption Rate (DAR): Measures how effectively users engage with new tools. Programs with over 60% adoption in the first 90 days are far more likely to succeed.
- Return on Digital Investment (RODI): Tracks financial benefits vs. costs. A healthy program aims for a 1.5x ROI within 2 years and 2.5x by year 5.
- Customer Satisfaction (NPS): Evaluates how digital efforts impact loyalty. Even a 1-point NPS improvement can boost revenue significantly.
- Employee Experience: Looks at how workplace tools affect productivity and morale. Metrics like eNPS and Time-to-Productivity highlight internal impact.
- Operational Efficiency: Focuses on reducing process cycle times, increasing automation, and cutting costs.
Why These Metrics Matter:
- Only 35% of digital transformation efforts succeed globally.
- Tracking these metrics ensures alignment with business goals and provides clear accountability.
- Organizations that monitor financial, customer, process, and workforce outcomes are 20% more likely to achieve high enterprise value.
Start with these five metrics to ensure your digital transformation delivers measurable, meaningful results.
5 Digital Transformation Governance Metrics: At-a-Glance Comparison
1. Digital Adoption Rate
What It Measures
Digital Adoption Rate (DAR) is all about how effectively people are using digital tools in their daily work. It’s not just about logging in but focuses on actual behavior - like completing tasks, meeting deadlines, and maintaining quality. To calculate DAR, use this formula: (Active Users ÷ Total Potential Users) × (Features Used ÷ Total Features Available). This gives a clear picture of both how many people are engaging with the tool and how much of its functionality they’re using. It’s a critical metric for governance teams to keep an eye on.
Why Governance Teams Should Track It
DAR serves as an early warning system for governance teams. Gartner highlights that "User adoption rate within the first 90 days is the single strongest predictor of overall program success." If adoption doesn’t hit 60% within that time, the program is unlikely to recover enough to meet its original goals - no matter how smoothly the technical rollout went.
Low adoption doesn’t just stall progress; it wastes resources. Employees often revert to familiar systems, which undercuts ROI and creates inefficiencies that traditional project metrics might miss.
What a Healthy Improvement Trend Looks Like
Successful programs typically see a 37% improvement in user proficiency by the end of the first three months. After that, a good trend includes fewer shadow systems and workarounds, higher workflow completion rates, and a shift where managers focus on coaching digital habits rather than solving tech issues.
For B2C organizations, the goal is usually a 70–80% digital adoption rate by the third year of a transformation. Governance teams should aim to establish a clear baseline within the first 60 days and then track progress against role-specific proficiency benchmarks, rather than relying solely on aggregate login data.
Here’s a breakdown of key benchmarks for digital adoption:
| Benchmark | Target | Timeframe |
|---|---|---|
| 90-Day Adoption Threshold | >60% | Day 90 post-launch |
| General Engagement Target | >80% | Ongoing |
| Time-to-Proficiency Lift | 37% improvement | Month 3 |
| Digital Channel Adoption (B2C) | 70–80% | Year 3 |
sbb-itb-97f6a47
Top Digital Transformation KPIs and Performance Measures [How to Measure Transformation Results]
2. Return on Digital Investment
When it comes to digital transformation, showing adoption is one thing, but proving financial returns is what truly demonstrates the value of your investment.
What It Measures
Return on Digital Investment (RODI) looks at the ratio of total business benefits achieved compared to the costs of a digital program. This metric is typically reviewed every quarter to see how actual results stack up against the original goals set in the business case. But RODI isn’t just about profits and losses. It also reflects how effectively your technology investments align with and advance your broader enterprise strategy. This includes improvements in areas like operational efficiency, customer experience, and even innovation.
Why Governance Teams Should Track It
Here’s a tough reality: 73% of business leaders admit they struggle to pin down the right metrics for measuring digital value. Without clear metrics, a project might hit its deadlines and stay within budget but still fail to deliver any meaningful business impact.
For governance teams, tracking financial transformation KPIs can make a big difference. Those who do so are 1.8 times more likely to secure funding for future transformation phases. RODI gives boards and executives the data they need to answer the critical question every CFO will eventually ask: Are we seeing real returns on this investment?
"The central issues to determine are how you're allocating capital to make this digital transformation and how you are measuring the return on the investment." - Laura McGarrity, EY-Parthenon Principal
How It Is Calculated
The formula for RODI is simple: (Net Benefit ÷ Total Digital Investment) × 100. To get a complete picture of value, benefits are tracked across three tiers:
- Tier 1: Direct returns, such as revenue from e-commerce.
- Tier 2: Enabled benefits, like a CRM system that shortens lead response time and increases conversions.
- Tier 3: Systemic gains, such as better data quality that supports smarter long-term decisions.
This tiered approach ensures teams don’t overlook indirect or long-term benefits. Early indicators, such as adoption rates or process cycle times, can also help predict financial ROI three to nine months in advance.
What a Healthy Improvement Trend Looks Like
| Metric | Target | Timeframe |
|---|---|---|
| Technology ROI (Benefit/Cost) | >1.5x | End of Year 2 |
| Technology ROI (Benefit/Cost) | >2.5x | End of Year 5 |
| Time-to-Value | <90 days | First measurable benefit (phased programs) |
| Cost per Transaction | 30–50% reduction | Fully digitized processes |
| IT Cost per User | 20–40% reduction | Within 2 years (cloud migration) |
Here’s a real-world example: In May 2025, a global retailer used RODI metrics to measure the success of its omnichannel and supply chain automation transformation. The results were impressive - an 18% drop in fulfillment costs, a 27% rise in digital sales, and a 30% reduction in stockouts. These financial achievements laid the groundwork for assessing the broader impacts on customers and employees through additional metrics.
3. Customer Satisfaction (NPS)
Financial results tell one side of the story, but Net Promoter Score (NPS) reveals how digital transformation impacts customers.
What It Measures
NPS is calculated by asking customers: "How likely are you to recommend [Organization/Product/Service]?" Responses on a scale from 0 to 10 classify customers into three groups:
- Promoters (9–10): Loyal enthusiasts who will keep buying and refer others.
- Passives (7–8): Satisfied but unenthusiastic customers.
- Detractors (0–6): Unhappy customers who may damage your brand through negative word of mouth.
For governance teams, NPS serves as a clear indicator of whether digital efforts are fostering loyalty or creating obstacles.
"NPS reveals whether your digital investments are translating into meaningful customer relationships or merely introducing new friction points." - William Flaiz
This segmentation highlights why monitoring NPS is essential for understanding customer impact.
Why Governance Teams Should Track It
NPS isn’t just a customer metric - it’s a predictor of churn and revenue growth, both critical for long-term success. Companies that include NPS in their measurement frameworks are 20% more likely to achieve high enterprise value from digital transformation. Even small shifts in customer experience can have a big financial impact. For example, a 1-point improvement in a Customer Experience Index score can generate $175 million in additional revenue for a $1 billion business.
How It Is Calculated
The formula is simple: % Promoters − % Detractors = NPS. While Passives are part of the total response pool, they don’t directly affect the score. For governance, it’s best to use relational NPS - collected quarterly or annually - to avoid the bias of post-transaction surveys. Including an open-ended follow-up question like "What is the primary reason for your score?" can provide deeper insights. To ensure reliable data, aim to survey at least 10% of your customer base or collect a minimum of 200 responses per period.
What a Healthy Improvement Trend Looks Like
Rather than focusing solely on the score itself, pay attention to consistent improvement over time. A positive trend includes:
- Quarter-over-quarter growth in NPS
- A shrinking percentage of Detractors
- More Passives converting into Promoters
To benchmark your progress, use industry standards from Bain & Company, Satmetrix, and SurveyGauge:
| Industry | Average NPS Range | Top Quartile |
|---|---|---|
| Consulting | 40–68 | 72+ |
| Technology / SaaS | 30–55 | 62+ |
| Retail / E-commerce | 35–60 | 65+ |
| Financial Services | 20–45 | 55+ |
| Telecommunications | −5–20 | 30+ |
A realistic goal for governance teams is to aim for the top quartile within your industry. However, be cautious about linking employee bonuses to NPS, as this can lead to data manipulation and unreliable results.
Tracking a rising NPS shows that your digital initiatives are connecting with customers, reinforcing the overall success of your transformation efforts.
4. Employee Experience and Engagement
While NPS focuses on external sentiment, Employee Experience and Engagement shifts the lens inward, examining how workplace technology affects productivity and employee commitment. This metric complements external measures by highlighting the importance of balancing customer impact with internal operational efficiency in digital transformation.
What It Measures
This metric goes beyond simple uptime statistics, delving into the digital friction employees face - things like slow load times or cumbersome login processes that can derail productivity. Brett Ayres, CTO of Teneo, explains it well:
"Technology may function correctly while still failing to deliver a seamless user experience."
It also evaluates whether workplace tools facilitate or hinder tasks, gauges employee trust in leadership during periods of change, and assesses key moments in the employee lifecycle. For instance, it looks at how quickly new hires can become fully productive and whether employees feel they have opportunities for internal advancement.
Why Governance Teams Should Track It
A poor digital experience doesn’t just frustrate employees - it creates tangible risks for the business. When tools are slow or inefficient, employees may turn to unauthorized apps (Shadow IT) to bypass these issues, exposing unresolved digital friction.
The financial implications are hard to ignore. Replacing one employee can cost anywhere from 50% to 200% of their annual salary, and disengaged employees are much more likely to leave within a year. On the flip side, highly engaged teams can drive up profitability by as much as 23%. Tracking this metric allows governance teams to spot problems early and address them before disengagement jeopardizes transformation efforts.
How It Is Calculated or Observed
A good starting point is the Employee Net Promoter Score (eNPS), calculated by subtracting the percentage of detractors (ratings 0–6) from the percentage of promoters (ratings 9–10) in response to the question, "Would you recommend this company as a place to work?". This provides a quick snapshot of employee sentiment.
For deeper analysis, organizations can use a DEX Score, which combines technical data - like app crash rates and system latency - with employee survey feedback. Other operational metrics, such as Time-to-Productivity (how quickly new hires can work independently) and Internal Mobility Rate (how often employees move into new roles internally), provide additional insights into how well the digital environment supports growth.
By monitoring these metrics, governance teams can identify areas for improvement and refine their strategies to enhance the workplace experience.
What a Healthy Improvement Trend Looks Like
Instead of focusing on a single number, governance teams should aim for steady progress across multiple metrics:
| Metric | Healthy Benchmark | What It Signals |
|---|---|---|
| eNPS | +10 to +30 (Good); +50 (Excellent) | Overall employee advocacy and sentiment |
| Survey Participation | ≥75% for pulse; ≥80% for annual | Trust in leadership and the feedback process |
| Internal Mobility Rate | 10–15% annually | Confidence in future growth and clear career paths |
| 90-Day Retention | ≥85% | Effective onboarding and integration |
| Time-to-Productivity | 60–90 days | Efficiency in enabling new hires |
A strong signal of improvement is when IT support ticket volumes drop while service quality rises. This shift indicates that issues are being resolved proactively - often before employees even notice them. Such a transformation, from reactive to proactive support, reflects a maturing digital environment. Ultimately, ensuring a seamless internal digital experience is just as critical to transformation as customer satisfaction and financial performance.
5. Operational Efficiency
Operational efficiency is a key measure of how effectively digital tools simplify and accelerate work processes. It’s the clearest indicator of whether technology is delivering on its promise to make tasks faster, cheaper, and more reliable. Jacob Stålbro, Head of Innovation at Opsio, explains:
"Operational efficiency is the most common primary objective of digital transformation programs... These metrics are the first to move after implementation and provide the earliest signal of whether the program is on track."
Unlike financial metrics, which often take years to show results, operational metrics shift almost immediately after implementation. This makes them a valuable early warning system for governance teams.
What It Measures
Operational efficiency tracks how well digital tools reduce friction in workflows. It includes metrics like:
- Process cycle time: The time it takes to complete a task from start to finish.
- Automation rate: The percentage of steps completed without human intervention.
- Decision latency: The time between identifying a problem and resolving it.
It also uncovers hidden inefficiencies, such as excessive handoffs that delay completion or increase error rates. Another critical factor is resource leverage - how much output a team member can achieve with digital support. For instance, in April 2026, Louis Ducruet, CEO of Eprezto, shared that deploying an AI chatbot with a 70% resolution rate enabled a single support representative to manage over 20,000 customers. As Ducruet put it:
"Digital transformation metrics should not be abstract. Pick the one number that shows whether technology is actually creating leverage for your team."
Why Governance Teams Should Track It
If digital tools don’t fundamentally change how work is done, they offer little value. Raj Jagani, CEO of Tibicle LLP, emphasized:
"The real story is told by the metric that shows a decrease in the number of manual tasks. It's important to make money and move quickly, but if your team is still doing the same manual work after going digital, nothing has really changed."
A key focus is reducing manual tasks, as inefficiencies can be costly. For example, enterprise system downtime costs an estimated $5,600 per minute. Monitoring operational efficiency helps governance teams identify and address performance issues before they escalate into significant financial or operational setbacks.
How It Is Calculated or Observed
Three main formulas are used to measure operational efficiency:
- Efficiency Ratio: Output (e.g., units processed, customers served, or revenue) ÷ Input (e.g., hours worked, headcount, or cost).
- Operating Expense Ratio (OER): (Operating Expenses ÷ Total Revenue) × 100. A declining percentage indicates improvement.
- Process Efficiency Ratio: Value-added time ÷ Total process time. This highlights how much of the workflow is genuinely productive.
When analyzing cycle times, it’s important to report both the median and the 90th percentile. This approach minimizes distortion from outliers and highlights real bottlenecks.
What a Healthy Improvement Trend Looks Like
Successful digital transformation programs often aim for measurable improvements, such as:
- A 30–50% reduction in process cycle time within 12 months.
- A 20–40% reduction in IT cost per user within two years.
To ensure accurate tracking, establish a 90-day baseline before starting any project. Without pre-implementation data, it’s nearly impossible to attribute efficiency gains to the transformation rather than external factors.
Here’s a breakdown of core metrics governance teams should monitor:
| Operational Metric | What It Measures | Healthy Target |
|---|---|---|
| Process Cycle Time | End-to-end time from trigger to output | 30–50% reduction within 12 months |
| Automation Rate | Percentage of steps executed without human input | 60–80% for targeted processes |
| Error/Exception Rate | Percentage of automated tasks needing manual fixes | Below 5% at 90 days; below 2% at 12 months |
| IT Cost per User | Total IT OpEx divided by active headcount | 20–40% reduction within 2 years |
| Decision Latency | Time from problem identification to resolution | Reduction from days to hours |
A practical example highlights these metrics in action. In April 2026, Joe Spisak, CEO of Fulfill.com, shared how digitizing fulfillment operations with real-time inventory scanning reduced decision latency from 22 days to just 4 hours. Inventory accuracy improved from 94% to 99.7%, and customer complaints dropped by 81% in one quarter. Spisak summed it up:
"Speed of correction beats perfection every time. Your warehouse doesn't need to be flawless - it needs to catch and fix problems before customers notice."
These metrics collectively provide a comprehensive framework for governance teams, tying together adoption, financial outcomes, customer experience, and workforce engagement with operational results that demonstrate the true impact of digital transformation.
Metric Comparison Table
Each governance metric highlights a specific aspect of digital transformation success. These metrics rely on various data sources and address unique questions, helping leadership make informed decisions. The table below provides a side-by-side comparison to show how each metric fits into your governance framework.
| Metric | Primary Governance Purpose | Typical Data Source | Best Use Case |
|---|---|---|---|
| Digital Adoption Rate | Confirms behavior change and ensures users aren't reverting to old systems | Identity/SSO logs, app telemetry, product analytics, LMS data | New software implementations or platform transitions |
| Return on Digital Investment | Links spending to measurable business value for financial accountability | ERP, financial systems, budget reports, TCO models | Gaining board approval for budgets and prioritizing long-term investments |
| Customer Satisfaction (NPS) | Evaluates whether digital experiences reduce friction or introduce it | Post-interaction surveys, CRM feedback, contact center logs | Improving customer-facing processes like onboarding or support |
| Employee Experience | Measures workforce alignment and skill-building progress | HR sentiment surveys, LMS proficiency scores, training completion logs | Large-scale operational changes or cultural shifts |
| Operational Efficiency | Tracks process speed, reliability, and identifies inefficiencies | ERP systems, workflow timestamps, IT monitoring tools (e.g., Datadog) | Streamlining processes, optimizing supply chains, or modernizing infrastructure |
This comparison emphasizes how these metrics collectively strengthen governance frameworks. By reviewing them together, teams can quickly spot gaps, align priorities, and ensure strategies stay on track.
It's worth noting that adoption and operational metrics often provide early performance insights, while financial and customer outcomes typically lag by three to nine months. Organizations that adopt a multidimensional approach - covering financial, customer, process, and workforce outcomes - are 20% more likely to report high enterprise value from their transformations. As Rejoice Winning aptly stated:
"Digital transformation succeeds when customers and employees can do more, faster, with less risk - and you can prove it with consistent metrics."
To maintain focus, aim to track 8–12 KPIs - 2 to 3 per domain - and assign each a clear owner with actionable steps tied to any major changes.
Conclusion
Governance metrics play a key role in determining whether digital transformation efforts deliver real value. As mentioned earlier, more than two-thirds of organizations focus on meeting project deadlines and budgets rather than achieving meaningful business outcomes. This often results in projects that look successful on paper but fail to drive real impact.
The five metrics discussed provide leaders with a well-rounded view, covering financial, customer, operational, and workforce outcomes. When used together, these metrics establish a framework of accountability that ensures transformation efforts stay aligned with organizational goals and deliver measurable results.
Here’s one critical principle to remember: every metric needs an owner. As Rejoice Winning aptly said, "A KPI that has no owner dies quietly." To make these metrics effective, assign clear ownership, set baselines, and review progress consistently.
If your organization is ready to adopt these strategies, check out the Top Consulting Firms Directory to find experts in digital transformation and performance management.
FAQs
How do I set baselines for these metrics before launch?
Before diving into any new technology or process updates, it's critical to document your current performance. This means gathering data from your existing systems, such as your ERP for financial metrics, CRM for customer insights, or HRIS for productivity tracking. These systems are treasure troves of information that can help you understand where you currently stand.
Each KPI (Key Performance Indicator) should have three essential elements:
- A dedicated owner responsible for tracking it
- A specific target to aim for
- A clear method of measurement to ensure consistency
And here's the thing: without timestamped pre-launch data, it’s impossible to verify or attribute any improvements accurately. Skipping this step could leave you guessing whether your changes actually worked.
Who should own each transformation KPI in governance?
Each digital transformation KPI needs a dedicated owner, aligned with the organization’s governance structure. This person should have the authority and resources to take action if the KPI starts to slip. Assigning ownership before launching the program ensures that KPIs serve as effective management tools, rather than just being used for audits.
What data sources do I need to measure all five metrics?
To measure progress in digital transformation, start by collecting data from your main systems of record. For financial and process-related metrics, tap into your ERP system. CRM platforms are ideal for tracking pipeline and revenue data, while your HRIS can provide insights into workforce trends. For technical metrics, such as system uptime, use monitoring tools like Datadog or CloudWatch. If you need more direction, consider consulting resources or experts who specialize in digital transformation.