Dynamic pricing models adjust prices in real time using AI and machine learning to analyze factors like demand, competition, and historical data. These models are widely used in industries like e-commerce, travel, and retail to maximize profits. But without proper validation, they risk setting prices too high or too low, leading to lost revenue or dissatisfied customers.
Key Takeaways:
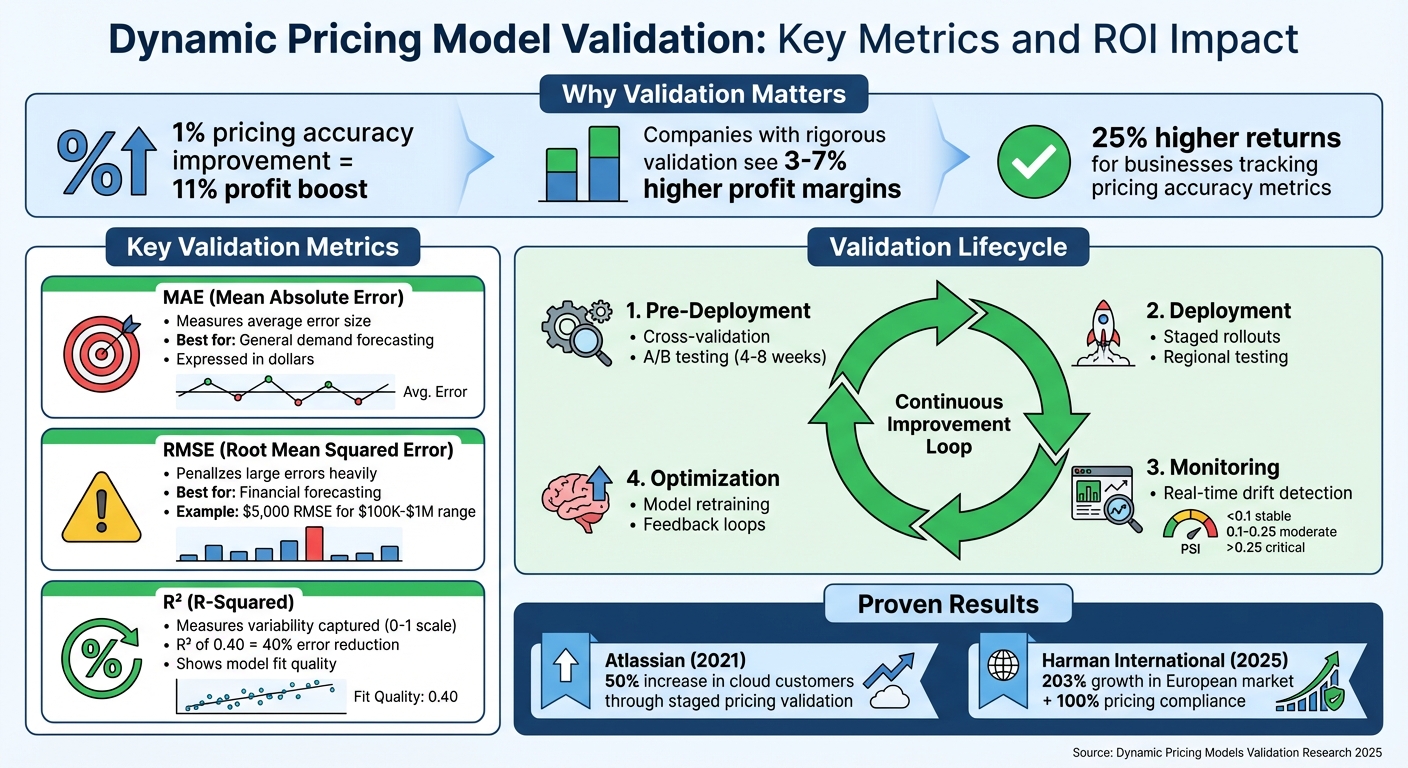
- Why Validation Matters: Ensures accurate, reliable pricing decisions, avoiding costly errors. A 1% improvement in pricing accuracy can boost profits by 11%.
- Metrics to Measure Performance: Use metrics like MAE (Mean Absolute Error), RMSE (Root Mean Squared Error), and R² (R-Squared) to evaluate model accuracy.
- Validation Techniques: Methods like cross-validation, stratified sampling, and sensitivity analysis help ensure models perform well across different scenarios.
- Post-Deployment Monitoring: Continuous monitoring detects issues like data drift, concept drift, and schema drift, ensuring long-term model reliability.
- Controlled Testing: A/B testing and staged rollouts validate pricing strategies before full implementation, reducing risk and improving outcomes.
Dynamic pricing models can deliver significant profit increases, but only if they are rigorously tested and monitored. Companies that prioritize validation see higher margins and sustained success.
Dynamic Pricing Model Validation: Key Metrics and ROI Impact
Key Metrics for Evaluating Model Performance
Understanding MAE, RMSE, and R²
When it comes to assessing dynamic pricing models, three metrics often take center stage: Mean Absolute Error (MAE), Root Mean Squared Error (RMSE), and R² (R-Squared). Each serves a unique purpose, offering insights into a model's accuracy and reliability.
MAE calculates the average size of errors by measuring the absolute difference between predicted and actual prices. It treats all errors equally, making it a straightforward and reliable choice when outliers are not the main concern. For example, if a predicted price is $50 and the actual price is $45, the error is $5. This metric is especially useful for general demand forecasting, where occasional price spikes shouldn't dominate the evaluation.
RMSE, on the other hand, takes error measurement a step further by squaring the differences before averaging them, then taking the square root. This approach penalizes larger errors more heavily. As Ayo Akinkugbe puts it:
"RMSE is one of the most popular regression metrics... It offers the mathematical benefits of MSE with results in the same units".
RMSE is ideal for situations where large pricing errors carry significant consequences, such as in financial forecasting. For instance, an RMSE of $5,000 might seem acceptable in the context of house prices ranging from $100,000 to $1,000,000.
Both MAE and RMSE are easy to communicate to stakeholders because they are expressed in dollars. When choosing between the two, use RMSE if large errors are particularly costly, and opt for MAE if your dataset contains frequent outliers that shouldn't disproportionately influence the results.
R² evaluates how well the model captures price variability on a scale from 0 to 1. An R² of 0.40 (40%) means the model reduces the mean squared error by 40% compared to a baseline that predicts the mean for all prices. However, as Brandon Wohlwend explains:
"R-Squared does not tell us if the chosen model is good or bad, and it doesn't convey the reliability of the model. It only quantifies the variability in price explained by the predictors".
Together, these metrics provide a well-rounded view of model performance, balancing error size and variability.
How Metrics Support Pricing Objectives
Selecting the right validation metrics is crucial for building dynamic pricing models that meet specific goals like maximizing revenue, optimizing inventory, or maintaining customer satisfaction.
The choice of metric should align with the model's purpose. For revenue maximization, Mean Squared Log Error (MSLE) or its root counterpart (RMSLE) works well because they penalize underestimations more than overestimations - key when under-forecasting demand or price points could lead to missed opportunities.
For inventory optimization, Weighted Mean Absolute Percentage Error (wMAPE) is particularly effective. By assigning more weight to errors in high-volume products, wMAPE ensures accuracy where it matters most, minimizing costly inventory miscalculations.
When it comes to customer satisfaction, MAE is a strong choice. Its dollar-based error measurement ensures that the typical price offered to customers stays close to the predicted optimal value, avoiding distortions caused by outliers.
As Joyoshish Saha highlights:
"Evaluation metrics... define what 'error' means in a given context. Are we minimizing the average deviation? Are we penalizing large errors more harshly than small ones?".
In practice, combining metrics often offers the clearest picture. For example, use R² to measure how well the model captures overall variability, and pair it with RMSE or MAE to evaluate the size of pricing errors. This multi-metric approach ensures that the model is evaluated from multiple angles, supporting better decision-making for dynamic pricing strategies.
sbb-itb-97f6a47
Validation Techniques for Dynamic Pricing Models
Cross-Validation and Data Splitting
The choice of validation method should align with your pricing data's structure. K-fold cross-validation is a popular technique that divides the dataset into "k" subsets, training on k-1 folds and testing on the remaining one. By rotating through all folds, this method ensures the model identifies genuine patterns. It's particularly effective for new products with limited historical data.
For products with seasonal trends, time series cross-validation (also called walk-forward validation) is a better fit. Unlike standard k-fold, it respects the chronological order of data by training on past data and validating on future periods. This prevents data leakage, a critical concern in machine learning. As Sarah Lee, an AI researcher, emphasizes:
"Data leakage can have a significant impact on the performance of Machine Learning models, and it is essential to take steps to prevent it".
Stratified cross-validation is another useful approach, especially when your customer base spans diverse segments. For instance, if 70% of your customers are small businesses and 30% are enterprise clients, stratified folds maintain these proportions, ensuring consistent performance across different tiers. For clustered data, such as multiple transactions from the same customer or region, GroupKFold ensures that all samples from a specific group stay within a single fold, reducing the risk of information leakage.
Nested cross-validation takes it a step further by combining hyperparameter tuning (inner loop) with performance evaluation (outer loop). This method prevents the validation set from influencing model optimization. A practical tip: always fit scalers and encoders on the training fold before applying them to the validation fold. This avoids unintentionally leaking test data insights into the model.
These strategies form the backbone of robust validation for both basic and advanced features in dynamic pricing models.
Validating Advanced Features
When dealing with complex inputs like customer sentiment or behavioral indicators, sensitivity analysis is a valuable tool. It measures how small changes in data - like a slight adjustment in competitor pricing - impact predictions. If such changes lead to significant output variations, it could indicate instability in the model.
Another technique, purging, ensures a clean separation between training and validation datasets. By removing highly correlated observations, purging ensures the test set remains independent. This is especially important for time-series pricing data, where implementing a purge period of several days or weeks can enhance reliability.
Validating advanced inputs with these methods ensures that comparisons between models are fair and grounded in consistent performance metrics.
Comparing Model Performance
Once individual components are validated, it's time to compare overall model performance. When evaluating multiple algorithms, it's crucial to benchmark them against simpler forecasts - like the last known price or average price - to justify the added complexity.
For example, in August 2025, a B2B SaaS company implemented dynamic pricing and initially saw a 15% revenue increase. However, during economic downturns, the model struggled, particularly with enterprise clients. Rigorous cross-validation identified these weaknesses, prompting the company to redesign its approach. The result? A sustainable model delivering 8% revenue growth across all conditions.
Dynamic pricing carries significant potential. A 1% improvement in pricing accuracy can lead to an 11% profit boost for some businesses. Firms that rigorously validate their pricing models often see profit margins 3–7% higher than those relying on intuition. Companies with clear metrics for pricing accuracy can achieve returns up to 25% higher than their competitors.
Post-Deployment Validation and Monitoring
Real-Time Monitoring and Drift Detection
Once a machine learning model is deployed, the work doesn't stop - continuous monitoring is a must. Why? Because models can fail silently, producing predictions that seem fine but are actually off the mark when the input data starts to differ from the training data. This is where real-time monitoring steps in.
There are three key types of drift to watch for:
- Data drift: This happens when input features shift. Think about changing customer demographics or seasonal trends that weren’t part of the training data.
- Concept drift: This occurs when the relationship between inputs and outputs changes. For example, a "fair price" today might not hold the same appeal two years down the line due to inflation or new competitors.
- Schema drift: This involves structural changes in data pipelines, like renamed fields or altered data types, which can disrupt your model’s logic.
Pricing models face an extra challenge: the "ground truth" - whether a customer buys at a given price - often comes with a delay. To work around this, rely on proxy metrics for early warnings. For instance, monitor for sudden price increases (like 20% jumps) or unusual shifts in prediction patterns while waiting for sales data to confirm performance. Proxy metrics help bridge the gap between delayed feedback and immediate action. In fact, a survey by Algorithmia found that 75% of organizations prioritize model monitoring as a critical task.
Set up a tiered alerting system using the Population Stability Index (PSI). A PSI below 0.1 means performance is stable, 0.1 to 0.25 suggests moderate drift that needs attention, and anything above 0.25 calls for immediate retraining. Use statistical tests to detect drift: the Kolmogorov-Smirnov test for continuous variables like price and the Chi-Square test for categorical variables like customer segments. Focus on features that have the most impact on your model's performance.
When drift is detected, quick action is essential to keep your model performing as expected.
Model Retraining and Updates
Once monitoring flags critical drift, it’s time to retrain. Automated retraining pipelines should kick in when drift metrics cross predefined thresholds, ensuring your model stays relevant. But retraining doesn’t always mean starting from scratch. Instead, consider selective parameter updates. Techniques like the Subset Extended Kalman Filter allow you to adjust only the parameters most responsible for prediction errors, keeping the model structure intact.
Before deploying a retrained model, run it in shadow mode alongside the current production model. This "champion-challenger" setup lets you compare predictions against real outcomes without exposing customers to potential risks. Every new model version should pass automated quality checks integrated into your CI/CD pipeline before it goes live.
To keep things running smoothly, build a continuous feedback loop. Feed production metrics - like win rates or revenue per session - back into the training pipeline. The stakes are high: imagine a retail scenario with 10,000 products where a 5% error rate causes a $0.50 margin loss per item. That’s $25,000 in daily losses, adding up to over $9 million per year.
As IBM highlights:
"The accuracy of an AI model can degrade within days of deployment because production data diverges from the model's training data".
This highlights why post-deployment validation isn’t just a nice-to-have - it’s what keeps machine learning deployments effective and sustainable.
Controlled Testing Before Full Deployment
A/B Testing for Pricing Models
Before launching a new pricing strategy, A/B testing is a critical step to evaluate its effectiveness. Start by setting clear goals - are you aiming for short-term profit, improved customer value over time, or a stronger position against competitors? Create a specific, testable hypothesis, such as: "Reducing the price by 10% will increase conversions by 15%.".
Divide your audience randomly, usually in a 50/50 split, into a control group (current pricing) and a test group (new pricing). To keep results clear, test only one pricing variable at a time - whether it’s the base price, discounts, or bundled offers. Testing multiple changes at once makes it hard to pinpoint what’s driving the results. Also, ensure consistency across all customer touchpoints - product pages, shopping carts, checkout, and ads must reflect the same test price to maintain trust.
Avoid cutting tests short. Use statistical tools, like power calculators, to determine the right sample size and test duration. Most pricing experiments need several weeks to gather reliable data. Evaluate results using multiple metrics like conversion rate, Revenue Per Visitor (RPV), Average Order Value (AOV), and Customer Lifetime Value (CLV). As Jeff Bezos famously said:
"It's not an experiment if you know it's going to work".
Once you’ve completed A/B testing, take the next step by validating your findings through staged or regional rollouts.
Staged and Regional Rollouts
Even after successful A/B tests, moving directly to full deployment can be risky. Staged rollouts offer a safer path by introducing the new pricing model to a smaller portion of your audience first. This minimizes potential backlash from loyal customers who might expect consistent pricing. Start with products that face frequent price changes or heavy competition to reduce risks.
Regional rollouts provide another layer of validation. By testing different pricing strategies in specific markets, you can better understand how regional factors influence customer behavior. This approach also helps isolate the impact of pricing changes from other variables. To protect profitability, set clear guardrails, such as ensuring prices never fall below cost plus a margin.
A great example of this approach comes from Atlassian in 2021. When transitioning from server-based to cloud-based pricing, they tested various price points on small customer segments, closely tracking conversion rates and feature adoption. This cautious, data-driven rollout led to a 50% increase in cloud customers while maintaining high satisfaction rates.
Refining your pricing strategy can deliver impressive results. Research shows that a 1% improvement in pricing can lead to an 11% boost in operating profit, outperforming gains from customer acquisition (7.8%) or retention (6.7%). For the best insights, run pricing experiments for 4 to 8 weeks to capture a complete customer decision cycle. Keep a control group throughout the process to measure the true impact of your new model. During this pilot phase, monitor both financial outcomes and customer feedback, and expand only when the results are statistically solid.
Conclusion
Validation is the backbone of effective dynamic pricing. Without thorough testing, prices can end up too high or too low, leading to lost customers or missed revenue opportunities. The numbers tell the story: a 1% improvement in pricing accuracy can drive an 11% profit increase, and companies that rigorously validate their pricing models see profit margins 3–7% higher than those relying on intuition.
The strategies outlined - like cross-validation, performance metrics, A/B testing, and staged rollouts - are designed to ensure pricing models deliver consistent results in real-world scenarios. Cross-validation helps avoid overfitting to quirks in historical data, while post-deployment monitoring detects issues like data drift early on. Controlled testing, such as A/B testing, minimizes risk by validating pricing assumptions on smaller customer groups before scaling up.
"Pricing model validation isn't just a technical exercise - it's a strategic imperative." – Monetizely
This quote highlights the importance of treating validation as a critical business strategy. The best-performing companies don’t just create advanced pricing algorithms - they rigorously test them before risking revenue. For example, in 2025, Harman International rolled out an automated pricing system across 200 SKUs in 12 countries. Their detailed validation process boosted pricing policy compliance from 70% to 100% and drove 203% growth in one European market. This case clearly shows how validation can translate directly into growth and profitability.
Success in dynamic pricing goes beyond just accuracy. Metrics should also focus on revenue optimization, customer retention, and maintaining a competitive edge. Adding price boundaries can protect your brand during the learning phase, while staged rollouts provide valuable real-world feedback before scaling. Businesses that define and track pricing accuracy metrics achieve 25% higher returns, proving that systematic validation is a key driver of success. A robust validation process not only stabilizes revenue but also strengthens customer relationships and secures long-term competitive advantages.
FAQs
How do I choose MAE vs RMSE for pricing?
The decision to use MAE (Mean Absolute Error) or RMSE (Root Mean Square Error) hinges on the specifics of your pricing data and the kind of error you want to focus on. RMSE gives more weight to larger errors, making it ideal if avoiding big pricing deviations is a priority. On the other hand, MAE treats all errors the same, providing a straightforward average. Your choice should depend on whether reducing major errors or assessing overall performance matters more for your pricing model.
What’s the best validation method for seasonal pricing data?
When working with seasonal pricing data, backtesting with resampling techniques is the most reliable way to validate your models. These methods are designed to address stationarity issues and minimize biases, which are common challenges in time series data.
Another effective approach is using cross-validation methods tailored specifically for time series. These techniques take into account the distinct patterns and fluctuations in seasonal data, ensuring that the validation process aligns with the dynamic nature of such datasets. Together, these methods provide a strong foundation for building accurate and dependable pricing models.
When should I retrain a dynamic pricing model?
When market conditions shift, customer behavior evolves, or external factors disrupt the norm, it's time to retrain your dynamic pricing model. These changes can impact the model's ability to make accurate predictions, making updates essential.
Similarly, if validation techniques indicate a drop in the model's performance - such as reduced accuracy or less reliable outputs - retraining becomes critical. Regular updates ensure the model continues to deliver precise and effective pricing strategies.