Functional benchmarking helps businesses improve specific functions - like IT, HR, or finance - by comparing them to leaders across industries. Unlike competitive benchmarking, it focuses on learning from the best practices of top-performing organizations, regardless of their field. By using metrics like cost, productivity, efficiency, and cycle time, companies can identify gaps, make data-driven improvements, and achieve measurable results.
Key takeaways:
- What it is: Comparing business functions to top performers outside your industry.
- Why it matters: Identifies inefficiencies and drives improvements.
- Steps to implement: Define goals, choose metrics, collect data, analyze, and monitor progress.
- Tools to use: Platforms like Tableau, IBM Cognos Analytics, and Gartner IT Score simplify benchmarking.
- Future trends: AI and cross-industry benchmarking are reshaping how organizations measure performance.
The right tools and a structured approach can turn insights into actionable improvements, helping organizations optimize operations and stay competitive.
How to Make a Benchmark in 6 easy Steps?
Key Metrics for Functional Benchmarking
Metrics transform benchmarking data into practical steps for improvement. The key is to select metrics that align with your organization's priorities - whether that's reducing expenses, enhancing productivity, streamlining workflows, or speeding up delivery schedules. For example, world-class IT organizations operate with 22% lower IT costs than their peers, and a typical large company could save up to $36 million by narrowing the gap to these top-tier standards.
Gartner's maturity benchmarks, which are backed by data representing over $562 billion in combined IT spending, illustrate how standardized metrics enable meaningful comparisons. As Gartner emphasizes, "IT leaders must regularly examine and benchmark spending across multiple cost views to ensure smarter spending and better business outcomes". These metrics serve as the groundwork for the deeper analyses that follow.
Cost Metrics
Cost metrics help you understand where your budget is being allocated and uncover areas where you can make adjustments. For instance, total IT cost per FTE evaluates how effectively your workforce is being utilized. Cloud services costs as a percentage of total IT costs measures your progress in shifting from traditional infrastructure to cloud-based solutions, which can help you manage consumption-based expenses. Additionally, IT spending as a percentage of revenue provides a snapshot of how your technology investments stack up against your earnings, while total cost per end user highlights the per-person expense of supporting your workforce.
Breaking down functional and process costs by specific activities can reveal inefficiencies. Labor costs, often the largest portion of functional budgets, require close scrutiny for both internal and external teams. When comparing costs, using standardized taxonomies like the Apptio TBM Unified Model ensures fair comparisons, while adjusting for factors like industry, revenue, and location accounts for variations in scale.
Productivity Metrics
Productivity metrics focus on how well your teams convert inputs into outputs. For example, end users serviced per FTE measures staffing efficiency and workload capacity, while revenue generated per employee links functional performance directly to business results. These metrics become most meaningful when benchmarked against similar organizations.
Advances in real-time, AI-driven platforms now allow organizations to analyze vast amounts of benchmarking data. Research shows that data-driven organizations are three times more likely to report noticeable improvements in decision-making compared to those that rely less on data. To ensure consistency, use a common process framework like APQC's Process Classification Framework (PCF) when comparing metrics such as "time to hire" or "invoice processing" across departments.
Efficiency Metrics
Efficiency metrics focus on how effectively processes deliver value, rather than just their speed. For instance, Net Promoter Score (NPS) for IT services measures user satisfaction and the quality of services, while operational throughput tracks the volume of work handled within specific timeframes. Top-performing functions consistently show higher levels of production efficiency.
These metrics can also highlight imbalances in staffing and costs that might be reducing efficiency. However, context is crucial. As ICT Consultant Joseph Nduhiu advises, "IT benchmarking data should serve as a guide for improvement, not as a strict target". Some companies may intentionally maintain higher costs to prioritize customer satisfaction, reflecting a deliberate investment rather than inefficiency.
Cycle Time Metrics
Speed is another essential benchmark, and cycle time metrics measure how quickly outcomes are achieved. For example, time-to-market for products tracks the journey from concept to release, while closure timelines for skill gaps measure how quickly HR resolves talent shortages. These metrics can identify bottlenecks and show where your peers may have made advances that you can learn from.
World-class IT organizations require 9% fewer full-time equivalents (FTE) per employee compared to average organizations, illustrating how efficiency gains can ripple across the business. By consistently monitoring cycle times, you can spot trends within your organization and make ongoing improvements.
How to Implement Functional Benchmarking in 5 Steps
5-Step Functional Benchmarking Implementation Process
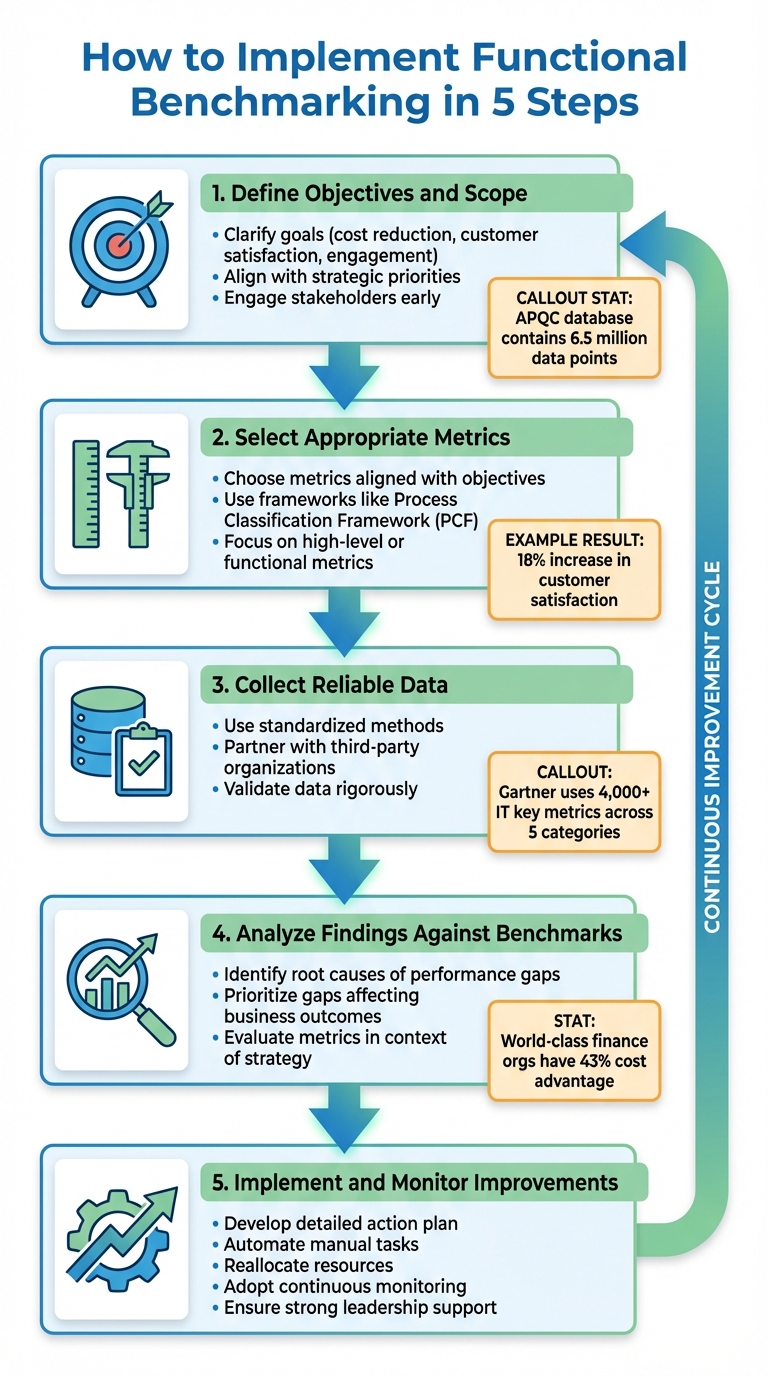
Functional benchmarking requires a structured, step-by-step approach, moving from setting clear goals to achieving measurable improvements. APQC's database of 6.5 million data points shows how standardized processes can lead to better outcomes. Following a clear roadmap ensures your team focuses on actionable results instead of getting bogged down in endless data collection. Here's a practical guide to help you move from data gathering to meaningful improvements.
Step 1: Define Objectives and Scope
Start by clarifying your goals - whether it's cutting costs, improving customer satisfaction, or boosting engagement. According to APQC, effective benchmarking can pinpoint improvement opportunities and drive meaningful change. Your objectives should align with your broader strategic priorities. For example, determine if a department is overstaffed and inefficient or understaffed and struggling to meet production targets.
Focus on areas with the most potential to impact your organization’s goals. For instance, one manufacturer streamlined its workforce and significantly reduced cycle times. Engage key stakeholders early to build support and avoid "benchmarking fatigue", a common trap where data is collected but never acted upon.
Step 2: Select Appropriate Metrics
Choose metrics that align closely with your objectives. Frameworks like the Process Classification Framework (PCF) can provide consistent benchmarks for comparison. Depending on your focus, you might use high-level metrics like revenue per employee or dive into more specific functional metrics for departments like HR, IT, or Finance.
For example, a financial services firm benchmarked its customer service performance against top e-commerce companies and found they were lagging in key areas. By focusing on metrics like customer satisfaction scores and revenue per customer service employee, they identified gaps. After implementing better communication tools and automating routine tasks, they achieved an 18% increase in customer satisfaction and improved revenue per employee.
Step 3: Collect Reliable Data
Gathering reliable data is critical. Use standardized methods and validate your information rigorously. Partnering with third-party organizations or industry groups can help you access neutral, anonymized data that competitors wouldn’t typically share.
"Each data point in our inventory is scrutinized by an APQC analyst, using logical and statistical validation checks".
This ensures only high-quality data informs your decisions. Combine quantitative metrics with qualitative analysis to uncover the reasons behind performance gaps. For instance, Gartner’s IT benchmarking tools use over 4,000 IT key metrics across five categories, showing how comprehensive data collection enables meaningful comparisons.
Step 4: Analyze Findings Against Benchmarks
Once the data is collected, focus on identifying the root causes of performance gaps. Gartner advises prioritizing gaps that significantly affect business outcomes. Rather than isolating metrics, evaluate them in the context of your overall strategy and business value.
For example, world-class finance organizations maintain a 43% cost advantage over their peers by consistently applying best practices. Use cross-functional data to spot inefficiencies, such as collaboration issues or departmental silos, and quantify improvement opportunities based on their potential impact.
Step 5: Implement and Monitor Improvements
Develop a detailed action plan that outlines specific initiatives, timelines, and responsibilities. Use your benchmarking insights to identify manual tasks that could be automated or eliminated to reduce costs. Reallocate underused resources from low-priority areas to high-priority needs.
Move away from treating benchmarking as a one-time effort. Instead, adopt continuous monitoring to track real-time progress and ensure ongoing optimization. Strong leadership support is essential to overcome resistance and sustain improvements over time. Regularly review progress to capture and build on successes.
Top Tools and Platforms for Functional Benchmarking
Selecting the right benchmarking tool can turn raw numbers into meaningful strategies. The best platforms combine extensive data sources with easy-to-use interfaces, helping you pinpoint performance gaps and prioritize improvements. Below are five standout options for functional benchmarking across various business areas.
Tableau
Tableau is all about transforming complex data into interactive dashboards, making performance comparisons more intuitive. Its tools help users prepare and standardize data before diving into analysis. One of its key features is the ability to create dynamic visualizations that update in real time as new data comes in.
"Traditional reporting and distribution tools can't offer the transformative speed to insight or the self-reliance of a modern approach to business intelligence with interactive, visual analytics."
To get the most out of Tableau, IT teams should collaborate closely with content creators and end users. This ensures the platform aligns with how teams actually work, avoiding the common issue of implementing tools that look impressive but fail to meet practical needs.
IBM Cognos Analytics
IBM Cognos Analytics taps into data from 42,000 organizations across 60 countries. It uses a patented survey method and offers access to more than 1,000 performance metrics across 18 industries. This ensures that comparisons are based on credible, globally recognized standards.
"Our patented custom survey method and toolset enable us to provide meaningful and accurate comparisons of performance tailored to each client's priorities."
The platform also delivers AI-driven insights. For example, financial organizations using AI report a 43% reduction in uncollectable balances, while those applying AI to hiring see a 30% decrease in employee acquisition costs. These data points can help justify investments by highlighting measurable returns.
KPI Fire
KPI Fire is a cloud-based solution designed for project management and metric tracking. While it doesn’t offer the depth of data found in IBM or Gartner tools, it strikes a balance by providing a straightforward option for tracking functional KPIs. This makes it ideal for mid-sized teams that want to monitor progress against goals without diving into overly complex analytics.
Gartner's IT Score for CIOs
Gartner IT Score is an interactive maturity assessment tool built on data from 2,000 benchmarks and insights from 4,130 CIOs across 21 industries. It evaluates how well IT supports business strategies by examining both the maturity and importance of specific activities. This dual approach helps leaders focus on closing the most impactful gaps first.
"Gartner IT Score for CIOs is a useful tool for getting a baseline measurement of IT's contribution to business strategy, and when building roadmaps for improving the effectiveness of operating models."
The "Pathway to Maturity" feature offers step-by-step guidance for capability improvement. With data representing over $562 billion in IT spending, this tool provides a strong basis for comparison. Customizing the assessment to focus only on relevant activities ensures its recommendations remain practical.
IIA Benchmark Hub
The IIA Benchmark Hub specializes in internal audit functions, tracking over 20 KPIs like budget, staffing, and training. Using Microsoft Power BI, it delivers interactive dashboards where users can filter results by industry, revenue, or asset size to find relevant peer comparisons.
"The IIA's Internal Audit Benchmark Hub™... will help you assess, measure, compare, and align an internal audit function's performance, practices, and processes with those of peers and industry leaders."
Updated semiannually, the platform prioritizes data integrity by enforcing strict anonymity measures. This makes it a valuable resource for audit leaders looking to justify budgets or demonstrate performance against industry standards.
| Feature | Tableau | IBM Cognos Analytics | Gartner IT Score for CIOs |
|---|---|---|---|
| Primary Focus | Visual analytics and self-service BI | Process optimization and AI-driven insights | Maturity assessment and peer comparison |
| Data Source | User-integrated data sources | APQC open standards (42,000 organizations) | 2,000+ benchmarks and 4,000+ IT data points |
| Key Strength | Interactive dashboards and data prep | Patented survey methods and industry-specific AI stats | Role-specific diagnostics (CIO, CISO, CDAO) |
sbb-itb-97f6a47
Future Trends in Functional Benchmarking
The landscape of functional benchmarking is evolving, with new trends reshaping how organizations measure and improve performance. AI, in particular, is turning traditional metrics into dynamic tools that not only evaluate past performance but also predict future outcomes and recommend actionable steps. Let's take a closer look at how AI and cross-industry comparisons are driving these changes.
AI and Machine Learning in Benchmarking
AI is transforming how organizations track and assess performance by introducing smarter KPIs. These metrics fall into three main categories: descriptive (explaining gaps in performance), predictive (forecasting future results), and prescriptive (offering specific recommendations). A striking 90% of managers using AI-enhanced KPIs report noticeable improvements, and companies adopting these tools are three times more likely to achieve meaningful financial gains.
Machine learning also plays a key role in identifying patterns that might otherwise go unnoticed. For instance, when Wayfair leveraged AI to analyze lost sales, it uncovered that 50%-60% of customers who initially rejected a particular sofa later purchased a similar product within the same category. This insight led Wayfair to shift its focus from product-specific KPIs to category-based retention metrics, improving both recommendations and logistics. Similarly, Google's analytics team discovered that the real driver of marketing success wasn’t just ad impressions but the percentage of ads where viewers both saw and heard the entire message. This realization led to a 30-point performance boost in just six months.
Real-time monitoring is another emerging trend. Sanofi's "Plai" app, for example, predicts out-of-stock scenarios up to four months in advance, enabling finance and sales teams to adjust their forecasts proactively. Looking ahead, 9 out of 10 executives plan to increase their AI budgets by 2025, spurred by these kinds of advancements.
While AI is revolutionizing internal benchmarks, looking beyond industry boundaries can unlock even more opportunities.
Cross-Industry Benchmarking
Cross-industry benchmarking helps organizations discover innovative practices by comparing their metrics with those from other sectors. According to research, 80% of executives now prioritize using benchmarking to accelerate new innovations, and 71% say it drives meaningful transformation within their organizations. However, challenges persist - only 61% of organizations maintain accurate workforce-related data, and differing definitions of metrics across industries can complicate comparisons.
Despite these hurdles, the benefits of cross-industry benchmarking are clear. Deloitte's research highlights that top-performing companies are 19 times more likely to evaluate whether their organizational structure aligns with external conditions. Additionally, organizations that integrate AI-driven KPIs with external benchmarks are five times more likely to align their incentive structures with business goals effectively.
These trends suggest that the future of benchmarking lies in combining the power of AI with insights gained from broader industry comparisons, creating a more comprehensive approach to performance improvement.
Working with Consulting Firms for Benchmarking Success
AI tools and benchmarking platforms can provide valuable insights, but many organizations discover that partnering with specialized consulting firms speeds up results and ensures proper execution. These firms bring something internal teams often lack: access to extensive, validated databases and proven methodologies. For instance, consulting firms often rely on proprietary databases to support their analyses. Take The Hackett Group, whose repository includes results from over 27,000 benchmarking engagements with nearly 9,100 major companies - covering 97% of the Dow Jones Industrials and 90% of the Fortune 100.
Beyond just data access, consulting firms provide objective, third-party validation. They run data through rigorous logical and statistical checks to ensure accuracy. This outside perspective is especially useful when internal politics might skew decision-making or when stakeholders require external validation to support significant changes.
Leading firms don’t just highlight gaps - they deliver clear, actionable roadmaps. These plans include prerequisites, enablers, and strategies for mitigating risks. As The Hackett Group puts it:
"We identify business best practices as those empirically proven to correlate consistently with 'world class' operational performance, with world class defined as top quartile performance in both efficiency and effectiveness process metrics".
In other words, organizations receive not only benchmarks but also evidence-based strategies shaped by thousands of similar projects.
When choosing a consulting partner, focus on the team rather than the brand. Helene Laffitte from Consource emphasizes:
"In consulting, it's the people who deliver the value".
Evaluate the team’s availability and track record. Ensure the firm uses standardized frameworks (like PCF) to ensure consistent and comparable results. The key question is whether the team has the specific expertise and industry knowledge required for your project.
For help finding the right partner, check out the Top Consulting Firms Directory (https://allconsultingfirms.com). This resource connects you with firms specializing in benchmarking, digital transformation, and operational optimization. It offers access to consultants with expertise in areas like Finance, IT, HR, and Supply Chain. Using this directory can simplify your search and help you find a partner who can turn insights into measurable improvements.
Conclusion
Functional benchmarking helps pinpoint performance gaps and turn insights into measurable actions. Whether you're analyzing costs, productivity, or cycle times, the ultimate aim is to address critical inefficiencies.
The tools mentioned - like Tableau's dashboards and Gartner's IT Score - offer a strong starting point for making informed decisions. However, these tools work best when paired with standardized frameworks, such as the PCF, and early involvement from stakeholders to ensure meaningful change.
For organizations committed to achieving measurable results, consulting firms can provide validated data, unbiased analysis, and actionable strategies that in-house teams might find challenging to deliver. For instance, companies that have fully embraced AI report impressive outcomes, such as a 43% drop in uncollectable balances within finance and a 30% reduction in talent acquisition costs per employee. These achievements are rooted in disciplined benchmarking practices.
Looking ahead, the integration of AI-driven automation and broader cross-industry comparisons will likely shape the future of benchmarking. However, the core principles remain the same: start with clear goals, select metrics that align with those goals, and collaborate with experienced consultants when needed. Whether you rely on internal expertise or seek external guidance through resources like the Top Consulting Firms Directory, the key lies in translating insights into action and maintaining progress over time.
FAQs
What is the difference between functional benchmarking and competitive benchmarking?
While both functional and competitive benchmarking aim to improve performance, they approach the task from different angles.
Competitive benchmarking focuses on measuring your company’s performance, products, or processes directly against your competitors. The goal? To see where you stand in your industry and uncover areas where you can outdo your rivals. It’s essentially a way to gain insights into how you compare and where you can push ahead.
Functional benchmarking, however, takes a broader view. Instead of limiting comparisons to your industry peers, it examines specific functions - like HR, IT, or finance - across companies in any industry. The idea here is to find and adopt best practices, regardless of the sector, to improve efficiency and effectiveness in certain areas.
To sum it up: competitive benchmarking is about staying ahead of your competition, while functional benchmarking is about learning from the best, wherever they might be.
What are the essential steps for effective functional benchmarking?
To put functional benchmarking into action, start by setting clear objectives that directly tie into your organization’s strategic goals. This step ensures the process stays focused and delivers meaningful insights. Next, take a close look at your current performance to pinpoint areas that need improvement and identify the metrics you’ll use for comparison.
Select benchmarking partners or industry standards that provide relevant and insightful comparisons. After gathering the data, perform a gap analysis to highlight performance differences and dig into the reasons behind them. These findings should lead to actionable recommendations and a clear plan to close the gaps. Lastly, establish ongoing monitoring systems to track progress and make adjustments as needed over time.
By following this structured approach, businesses can drive measurable progress and maintain a steady path toward improvement.
How do AI and machine learning improve functional benchmarking?
AI and machine learning are transforming functional benchmarking by making the process faster, more precise, and packed with actionable insights. These technologies can handle massive datasets with ease, enabling businesses to compare performance metrics in real time. This shift from static benchmarks to dynamic analysis helps companies spot trends and improvement opportunities much quicker.
With AI-driven tools, businesses can integrate predictive and adaptive KPIs, offering a clearer view of performance and operational outcomes. This alignment of benchmarking with strategic objectives allows organizations to allocate resources more effectively, spark new ideas, and maintain a competitive edge in an ever-changing landscape. Simply put, AI and machine learning are reshaping benchmarking to meet the demands of modern business.