A risk-based QA framework is all about focusing your testing efforts where it matters most: high-risk areas that could cause significant business problems. Instead of testing everything equally, this approach helps you prioritize based on two factors: likelihood of failure and potential impact. Here’s what you need to know:
- Why it works: Companies using this method report a 20% drop in testing costs and a 30% increase in defect detection rates. Google even cut test execution by 90% using risk analysis.
- How it’s different: Traditional QA tests everything. Risk-based QA asks, “What’s critical?”
- Key steps: Assess risks, rank systems by impact, define clear acceptance criteria, and align testing to business goals.
Key Steps at a Glance:
- Assess QA processes: Audit your current setup, interview stakeholders, and analyze past data to identify risks.
- Categorize systems: Rank features by business impact using a simple Likelihood × Impact formula.
- Set priorities: Focus 60–70% of testing on critical risks, with clear testing standards for each risk level.
- Deploy smarter tests: Use methods like automation for high-risk areas and exploratory testing for complex scenarios.
- Track results: Monitor metrics like defect escape rates and risk coverage to refine your process.
This framework helps you focus resources efficiently, reduce costs, and improve software reliability. Ready to dive in? Let’s break it down step by step.
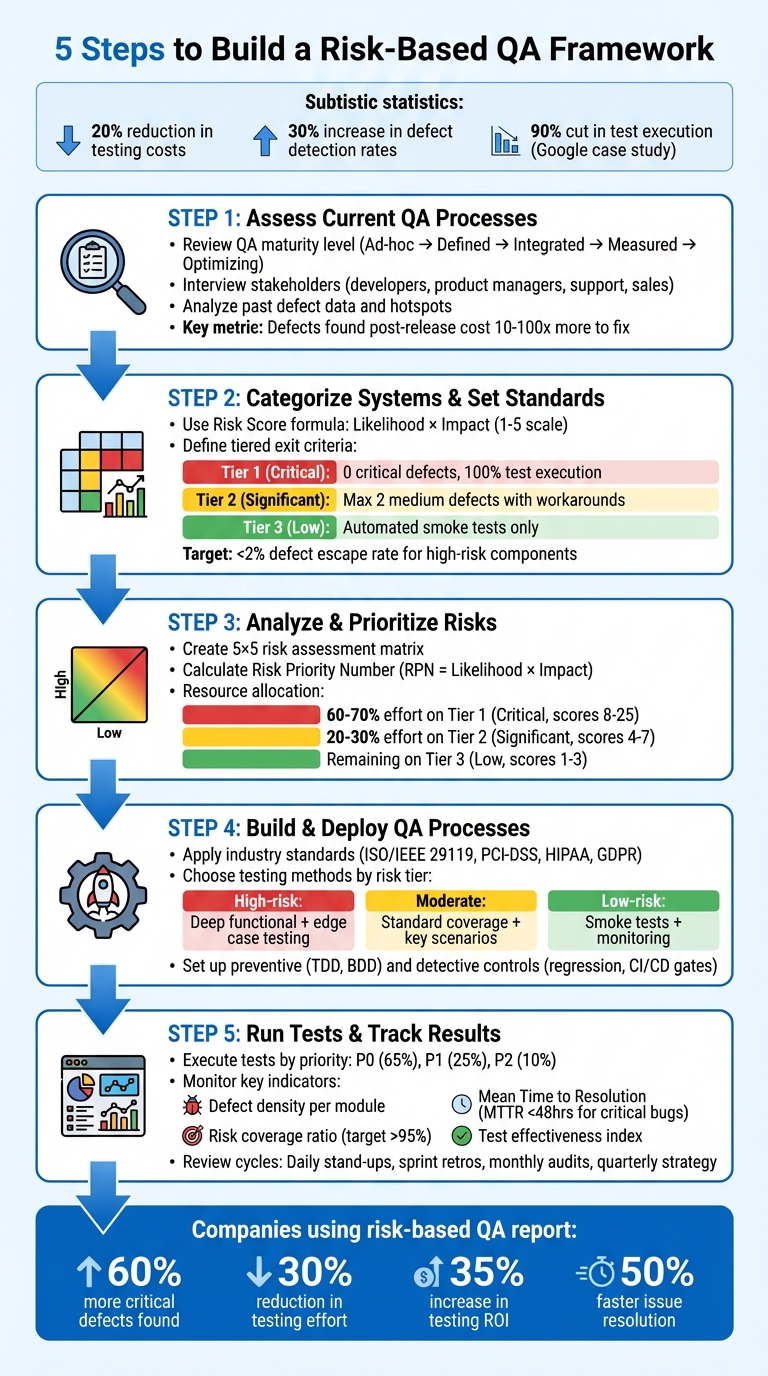
5-Step Risk-Based QA Framework Implementation Process
Step 1: Assess Current QA Processes and Identify Risks
Review Your Current QA Setup
The first step is to take a hard look at your QA processes using a QA Maturity Model. This model breaks down QA processes into five levels:
- Ad-hoc: Testing is reactive, with no documented strategy.
- Defined: A structured approach with written test plans in place.
- Integrated: Automated regression testing is part of your CI/CD pipeline.
- Measured: Decisions are guided by tracked metrics and data.
- Optimizing: Continuous improvement, often with AI-assisted testing.
Key focus areas for your audit should include process documentation, automation levels, metrics tracking, collaboration between teams, and continuous improvement practices. Make sure each testing phase has clear entry and exit criteria - something often overlooked at the Ad-hoc level. Also, confirm consistent use of tools like Jira or TestRail for bug tracking and keeping stakeholders informed.
For a thorough review, implement a structured 4-week audit:
- Week 1: Conduct a self-assessment using checklists.
- Week 2: Perform a gap analysis to identify weaknesses.
- Weeks 3–4: Develop a roadmap to address those gaps.
Keep in mind that defects found by customers post-release can cost 10 to 100 times more to fix than those caught earlier. After completing your audit, involve stakeholders to validate the findings and ensure no gaps are missed.
Interview Key Stakeholders
Stakeholders bring valuable perspectives to the table, especially when it comes to identifying risks. Gather input from a variety of groups - developers, product managers, customer support, and sales teams - through collaborative workshops. Each group offers unique insights: for example, developers can point out fragile or risky parts of the codebase, while customer support can share real-world examples of failures in high-priority workflows.
Marcin Godula, Chief Growth Officer at ARDURA Consulting, emphasizes this approach:
"The audit should include QA team leads and individual testers... development team leads... product owners... DevOps and SRE team members... and engineering management. Excluding any of these groups produces an incomplete picture".
Ask targeted questions like:
- "Which areas have historically caused failures?"
- "Where do you feel the code lacks confidence?"
Anonymous self-assessments can also help gather honest feedback about process gaps. High-performing QA teams aim for a defect escape rate of less than 5%.
Analyze Past Project Data
With your audit and stakeholder input in hand, dig into past project data to identify trends and problem areas. Look at defect records to find hotspots - modules or features with frequent failures or high complexity. Additionally, analyze metrics like defect density, code churn, and change frequency to uncover patterns where bugs tend to cluster.
Set baseline metrics for current performance, such as:
- Defect escape rates.
- Time from code commit to production.
- Number of customer-reported issues.
In organizations with mature QA practices, the Mean Time to Resolution (MTTR) for critical bugs is often under 48 hours. Tag production bugs as "escaped" in your tracking system to better understand process weaknesses. Use this data to map risks to specific modules, user flows, or integration points, and document these risks in a risk register.
sbb-itb-97f6a47
Step 2: Categorize Systems and Set Quality Standards
Classify Systems by Business Impact
After identifying risks, the next step is to rank systems based on their impact on the business. This ensures testing efforts focus on areas where failures could cause the most harm. Use a simple Risk Score formula: Likelihood × Impact, rated on a 1–5 scale. A score of 5 represents the highest potential for critical failure.
For impact, think about factors like financial exposure, user experience issues, regulatory concerns (such as GDPR or HIPAA compliance), and potential damage to your reputation. Likelihood, on the other hand, depends on things like code complexity, frequency of changes, the use of new or experimental technologies, and past defect rates.
Using a 1–5 scale helps maintain consistency without getting bogged down in unnecessary detail. For instance, a payment processing module with frequent updates and high complexity might score 20 (4 for likelihood × 5 for impact), making it a "Critical" system.
Here’s an example: In 2025, a major FinTech payment processor partnered with Full Scale to tackle quality issues impacting 2% of its transactions. By adopting a risk-based QA framework, the company introduced automated testing for over 1,200 payment scenarios and conducted load testing for 10,000 concurrent transactions. These efforts reduced transaction failures to just 0.01%, saving $2.3 million annually and achieving 99.99% uptime during peak periods.
Define Measurable Acceptance Criteria
Once systems are classified, the next step is to create specific, measurable standards that reflect their risk levels. Avoid vague terms like "fast performance" and instead set clear benchmarks, such as: "All user-facing features must load within 2 seconds on 3G connections". These criteria should align with overarching business goals, whether that means protecting revenue, ensuring compliance, or improving user retention.
Introduce tiered exit criteria based on system risk levels:
- Tier 1 (Critical): No open critical or high-priority defects and 100% test execution required before release.
- Tier 2 (Significant): Up to two medium-severity defects allowed, provided there are documented workarounds.
- Tier 3 (Low): Automated smoke tests with no blocking issues are sufficient.
For example, a HealthTech EHR provider adopted this approach and transitioned from six-month release cycles to eight-week cycles by automating 85% of regression tests. The results? Zero HIPAA compliance violations, 100% accuracy in patient data, and a 40% drop in QA workload.
Your acceptance criteria should cover:
- Functional use cases (including both happy paths and edge cases)
- Performance targets
- Security requirements
- Accessibility standards (e.g., WCAG 2.1 AA compliance)
Aim for a defect escape rate below 2% for high-risk components and under 5% for other features. Why is this so important? Fixing defects in production can cost 10 to 100 times more than addressing them during pre-release testing. These well-defined criteria provide a solid foundation for thorough QA testing, particularly in high-risk areas.
Risk-Based Testing Explained: A Smarter Approach to Quality Assurance
Step 3: Analyze and Prioritize Risks
Now that you've classified your systems, it's time to refine your risk evaluation with a more quantitative approach.
Create a Risk Assessment Matrix
A risk assessment matrix is a handy visual tool that helps you figure out which risks demand attention first. It's typically laid out as a grid, with Likelihood (how often a risk might occur) on one axis and Impact (the severity of its consequences) on the other. The go-to format in 2025 is the 5x5 matrix, which provides 25 distinct cells, giving you enough detail to separate risks effectively.
To make it work, define each rating level clearly. For instance, classify "Very High" likelihood as issues that occur three or more times annually, while "High" impact might mean financial losses exceeding $50,000 or a compliance breach. Use specific examples to keep scoring consistent across the board.
Once you've set this up, calculate a Risk Priority Number (RPN) by multiplying the Likelihood score (1–5) by the Impact score (1–5). For example, if a payment processing module has a likelihood score of 4 (indicating frequent failure) and an impact score of 5 (indicating severe consequences), its RPN would be 20. This marks it as a critical priority. To make things even clearer, try color-coding the matrix: red for high-priority risks, yellow for medium, and green for low.
"A validated matrix serves as a reliable decision-making tool." - Jason Doel, COO & CRO, Tracker Networks
Rank Risks by Priority
After assigning scores, turn those numbers into actionable testing priorities. Focus 60–70% of your testing effort on T1 (Critical) risks, which typically have scores between 8 and 25. Dedicate 20–30% to T2 (Significant) risks (scores 4–7), and reserve the remaining effort for T3 (Low) risks (scores 1–3).
When prioritizing, consider factors like how hard an issue is to detect and how expensive it would be to fix. For example, subtle authentication errors that are costly to address should take precedence over less impactful cosmetic issues, even if their scores are similar. To minimize bias during this process, try silent independent scoring, where team members rate risks individually before group discussions. Companies using this method have seen a 27% drop in defect rates.
Once you've ranked the risks, consolidate the data into a table for easy tracking and monitoring.
Display Risk Rankings in a Table
A well-organized table can help connect each risk to its system area and testing strategy. Here's an example:
| Risk Area | Likelihood (1–5) | Impact (1–5) | Risk Score | Priority |
|---|---|---|---|---|
| Payment processing | 2 | 5 | 10 | Critical |
| User authentication | 3 | 4 | 12 | Critical |
| Email formatting | 4 | 1 | 4 | Low |
| Report export (CSV) | 2 | 2 | 4 | Low |
Expand the table with additional columns for risk owners (who's responsible), triggers (conditions that activate the risk), and response strategies (whether you'll avoid, mitigate, transfer, or accept the risk). It's essential to keep this table updated - review it quarterly or after major system changes, as static spreadsheets can quickly become outdated.
Organizations that excel in quality management often resolve issues 50% faster, with cycle times under five days.
Step 4: Build and Deploy QA Processes
Turn the risk priorities identified in your earlier analysis into testing processes that align with the potential business impact.
Apply Industry Standards
Using your risk analysis as a starting point, adopt recognized frameworks to standardize your testing approach. Frameworks like ISO/IEEE 29119 offer a structured way to handle verification and validation, ensuring your testing is both well-documented and defensible. For projects in regulated industries, compliance standards are non-negotiable. For example, PCI-DSS and SOC 2 are essential for financial systems, HIPAA applies to healthcare projects, and systems managing European data must meet GDPR requirements.
To stay compliant, use tools like compliance checklists and a risk-based traceability matrix to connect regulatory requirements directly to test cases. For instance, if GDPR requires timely deletion of user data upon request, your matrix should link this to automated tests that validate the deletion process across various scenarios. Incorporate policy-driven test automation and synthetic data to replicate real-world situations.
Choose the Right Testing Methods
The level of risk dictates the testing approach. For high-risk areas (Tier 1), deep functional testing is critical. This includes edge case testing and regression tests. Take a payment processing system as an example: you might use boundary-value analysis to test credit limits at their minimum, maximum, and just beyond those thresholds, as well as state transition testing to ensure the entire order lifecycle works as expected.
For moderate risks (Tier 2), focus on standard coverage, including happy path testing and key negative scenarios. Here, a combination of scripted tests and selective automation works well. Low-risk areas (Tier 3) can often be handled with quick smoke tests or post-release monitoring to confirm nothing major is broken. When dealing with complex configurations, pairwise testing can help reduce the number of test cases while still covering critical combinations.
"The best testing strategy isn't the one that tests the most. It's the one that tests the right things - and can explain why." - TestMatick
Once you've selected your methods, establish controls to manage and minimize defects.
Set Up Preventive and Detective Controls
Preventive controls focus on avoiding defects from the start. Techniques like Test-Driven Development (TDD), where tests are written before code, ensure quality is built into the software from the beginning. Similarly, Behavior-Driven Development (BDD) uses simple, plain language to define expected behaviors, minimizing misunderstandings between teams. Static code analysis and collaborative risk workshops can also identify potential failure points before any code runs.
Detective controls aim to catch issues early in the testing process. Automated regression suites can monitor critical paths, while quality gates in your CI/CD pipeline can block deployments if high-risk tests fail. Exploratory testing in high-risk areas can uncover defects that scripted tests might miss. For modules with heavy workloads, fault injection and stress testing can reveal how the system handles errors or extreme conditions. Define clear exit criteria for each risk tier: Tier 1 might require no high-severity defects and a completed exploratory session, while Tier 3 may only need a successful smoke test.
Step 5: Run Tests and Track Results
Once you've prioritized risks, it's time to put your testing plan into action. Structure your test execution around defined tiers, and set up a monitoring system to ensure quality stays aligned with your business goals.
Launch Your Testing Framework
Organize your tests based on risk levels: P0 (Critical), P1 (High), and P2 (Medium). These are determined by combining likelihood and impact scores. Allocate your resources strategically: dedicate about 65% to Tier 1 (P0), 25% to Tier 2 (P1), and 10% to Tier 3 (P2).
Integrate this risk-based approach into your CI/CD pipeline. Start with P0 tests, which focus on the most critical risks, so you can catch major issues early. From there, move on to lower-priority tests. Use tagging and filtering within your automation tools to dynamically select tests based on the risk profile of code changes. For each tier, set clear entry and exit criteria. For example, P0 tests might require a 100% pass rate and no unresolved high-severity bugs before moving forward.
Assign a specific owner to each risk. This person will oversee testing and monitor mitigation plans throughout the project lifecycle. Companies using this method often report a 20% reduction in testing costs and a 30% boost in defect detection rates. Some teams even find 60% more critical defects while reducing testing effort by 30%.
Once testing begins, it's crucial to track progress with well-defined risk indicators.
Monitor Key Risk Indicators
Focus on metrics that provide a clear picture of your testing effectiveness. Key metrics include:
- Defect Density: Measures defects per module, helping you identify problem areas.
- Mean Time to Resolution (MTTR): Tracks how quickly high-risk bugs are resolved.
- Test Efficiency Ratio: Evaluates how many critical bugs are found per hour of testing.
Set quality gates to block deployments if critical tests fail. Use visual dashboards, such as risk burn-down charts and heat maps, to clearly communicate testing progress and risk exposure to stakeholders. Aim for a defect escape rate of less than 2% for high-risk components and a risk coverage ratio above 95% for all identified high-risk areas.
| Key Risk Indicator | What It Measures | Why It Matters |
|---|---|---|
| Risk Coverage (%) | Percentage of high/medium-risk items tested | Indicates how much of the riskiest areas have been validated. |
| Defect Escape Rate | Percentage of high-risk defects found in production versus pre-production | Assesses the effectiveness of your testing filters. |
| Test Effectiveness Index (TEI) | Combines risk coverage and severity of bugs caught | Shows whether your tests are targeting major failures effectively. |
| Mean Time to Detection | Average time from code commit to bug discovery in critical areas | Measures how fast you’re catching critical issues. |
Set Up Regular Review Cycles
Effective monitoring requires regular reviews to adapt to new risks. Treat your risk register as a dynamic document that evolves with your project. Update it frequently - during daily stand-ups, sprint retrospectives, monthly audits, or quarterly strategy meetings - based on production data.
After any production incident, conduct a post-mortem to update the risk register and expand test coverage in affected areas. Use historical data, such as pass/fail rates and production incidents, to validate your risk scores every 5–10 cycles.
Automate updates to risk scores using metrics like error rates and customer escalations. For example, if a module’s error rate exceeds 5%, increase its probability score automatically. Studies show that 80% of production defects often come from just 20% of application modules. By continuously monitoring and adjusting, you can focus on the areas that matter most.
Working with External Consultants
Once you've established and deployed your internal QA processes, bringing in external consultants can help refine and expand your framework.
Benefits of Digital Transformation Consultants
Creating a risk-based QA framework can be tough without advanced risk assessment expertise. External consultants provide an unbiased perspective by offering objective risk scoring, which helps eliminate internal biases when evaluating risk areas. They also conduct workshops with developers, product managers, and stakeholders to uncover potential failure scenarios that may not be captured in standard requirements.
These consultants often rely on established frameworks and risk catalogs, which can speed up the implementation process. In highly regulated industries, they ensure that QA frameworks comply with standards like GDPR, HIPAA, and PCI-DSS. For instance, Amazon used QA risk management combined with AI-driven automation to focus on critical areas like checkout and payment systems, leading to a 50% drop in high-severity bugs in production. Similarly, JPMorgan Chase integrated risk-based testing into their agile DevOps pipelines for mobile banking, prioritizing key areas like authentication and transactions, which helped them launch products 30–40% faster.
"Risk-based testing is not about testing less. It is about testing smarter." - Total Shift Left Team
If you're looking to gain these advantages, leveraging resources like the Top Consulting Firms Directory can help you find the right partner.
Finding Experts Through Top Consulting Firms Directory
When selecting a consulting partner, look for firms with expertise in areas like security, accessibility, and performance testing. It's also important to choose consultants with experience in your specific industry - whether that's fintech, healthcare, or retail - so they understand the unique regulatory and operational challenges you face. The Top Consulting Firms Directory (https://allconsultingfirms.com) is a valuable tool for finding experienced professionals who specialize in QA and risk management. This directory connects businesses with vetted experts, ensuring they have the certifications and enterprise-level experience needed to align with your digital transformation goals.
Before finalizing any agreements, confirm that your team will retain access to all proprietary tools, automation scripts (e.g., Playwright or Cypress), and test management data after the engagement ends. Start with a focused pilot project targeting a high-risk component to demonstrate the return on investment. Choose consultants who don't just supply testers but also lead risk identification workshops to foster a culture of risk awareness within your product teams.
Conclusion: Implementing Your Risk-Based QA Framework
Main Points to Remember
Shifting to a risk-based QA framework means prioritizing resources where they matter most. The idea is simple: calculate risk scores by multiplying the likelihood of an issue by its potential impact, and then use those scores to guide your testing efforts. High-risk areas should consume about 60–70% of your testing resources, while low-risk components only require basic smoke tests.
This framework isn't a one-and-done deal - it needs regular updates. Use sprint retrospectives, monthly audits, and reviews after production incidents to refine your risk scores and keep them relevant. Hosting workshops with key stakeholders can also uncover potential failure scenarios that might not be captured in standard requirements documents. These insights help shape a testing strategy that’s practical and focused on real risks.
The results speak for themselves. Companies adopting this approach have reported finding 60% more critical defects while reducing testing efforts by 30%. They’ve also seen a 35% increase in ROI on their testing investments. Preventing just one major production issue - like a failure in a payment system - can save significant revenue and safeguard your reputation.
How to Get Started
To kick things off, focus on the top 10–20 highest-impact user flows. Think of areas like authentication, payment processing, or critical data transactions. Use a straightforward 1–5 scale for both likelihood and impact to keep things consistent and avoid overcomplicating the process.
Integrate risk discussions into your Agile workflows. Set specific exit criteria for different risk tiers - for instance, Tier 1 might require zero open critical defects, while Tier 3 may only need a passing smoke test. To ensure your risk scores are accurate, validate them with historical pass/fail data from previous testing cycles. Prioritize automation for repetitive, high-risk regression tests, which allows your manual testers to focus on exploring critical areas.
FAQs
How do I score risk if we don’t have good defect data yet?
If you don’t have detailed defect data, a risk assessment approach can help. Start by evaluating two key factors: the likelihood of failure and its potential business impact. Assign numeric values to each, then multiply them to calculate a risk score. This score allows you to prioritize testing efforts on the areas with the highest risk, ensuring attention is directed toward the most critical parts of the system - even when defect history is limited.
What tests should be automated first in a risk-based QA framework?
Automating tests for high-risk areas should be your top priority, especially for critical functionalities like payment processing or identifying security vulnerabilities. Start by assigning each feature a risk score. This score is determined by multiplying the likelihood of failure by the business impact that failure would cause. Focus your automation efforts on tests with the highest risk scores to efficiently tackle potential failures that could have significant consequences.
How do we keep risk scores and priorities updated over time?
To ensure risk scores and priorities stay relevant, it's important to reassess risks frequently. This should be done whenever new data becomes available, systems are updated, or business impacts shift. Keep a close eye on factors like the likelihood of failures and the severity of their impact, making adjustments to scores as necessary. By using a structured risk assessment framework, teams can maintain accurate evaluations, zero in on high-risk areas, and allocate testing efforts where they matter most.