The main point: pick the advisor by the metric problem, not by the title. If your issue is board reporting, use a consultant. If execution is off plan, use an operating partner. If the deal model depends on synergies, use a PMI firm. If ERP, CRM, and billing data do not match, use a fractional tech leader.
I’d reduce the article to 4 buying questions:
- What decision do you need the metrics to support? Board review, monthly performance, integration, or data cleanup.
- What layer is broken? Return math, company performance, KPI tracking, initiative follow-through, or data quality.
- How close to the work does the advisor need to be? Quarterly design work is not the same as weekly issue management.
- Can the numbers be trusted? If not, no dashboard will help.
The article’s strongest point is simple: each advisor owns a different lane. Consultants define KPI rules and portfolio reporting. Operating partners use driver-level metrics to press action. PMI firms track synergies, one-time costs, and retention through the first 100 days and year 1. Fractional tech leaders fix reporting at the system and data layer.
For PE sponsors and portfolio CEOs, that means the shortlist should start with the gap:
- Definition gap - KPI canon, add-backs, portfolio reporting spine
- Execution gap - revenue bridge, margin leakage, DSO, churn, milestone misses
- Integration gap - synergy baseline, savings tracking, migration status, retention risk
- Data gap - reconciliation issues, latency, missing fields, control failures
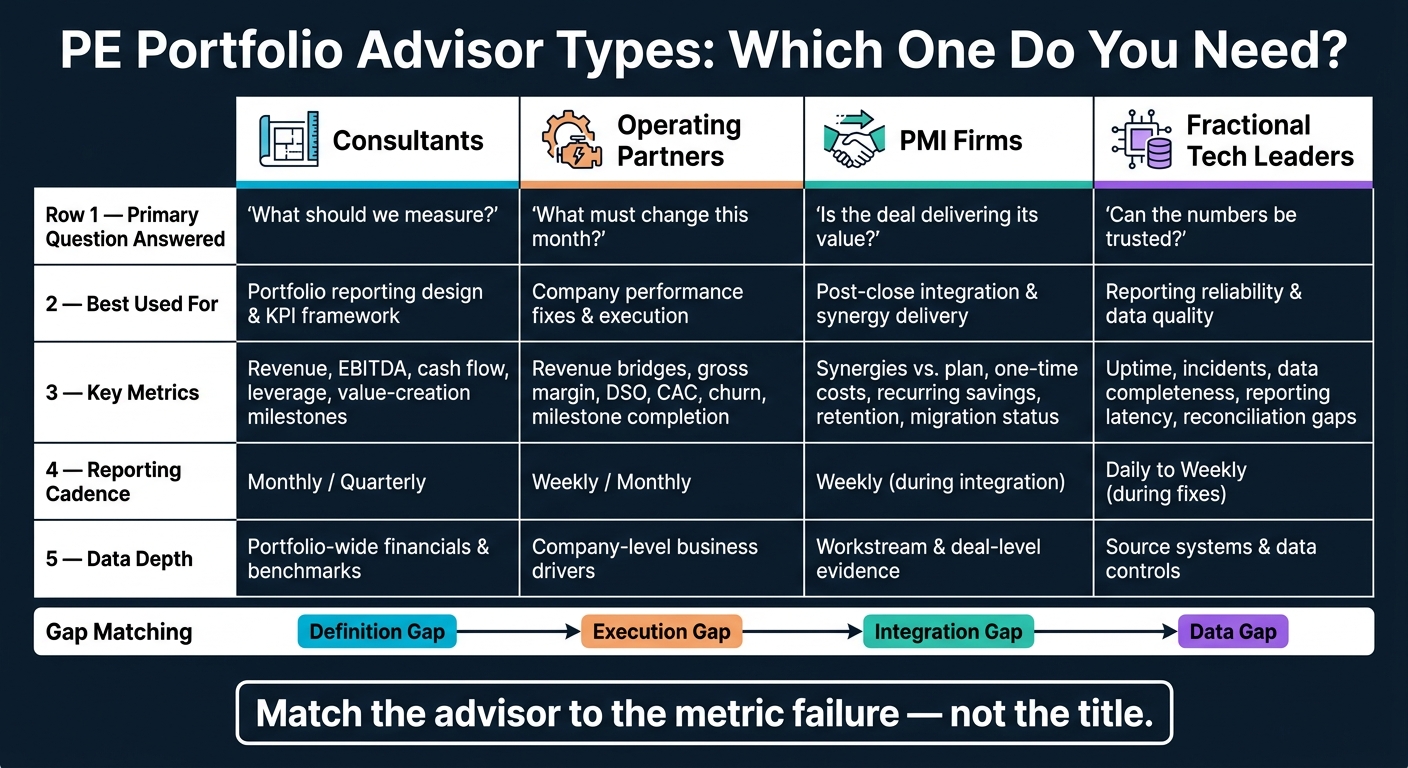
PE Portfolio Advisor Types: Scope, Metrics & Cadence Comparison
PE Pros Exposed: The Metrics That Make or Break Portfolio Companies
sbb-itb-97f6a47
Quick Comparison
| Advisor type | Best used for | Main metric focus | Typical cadence | What you should test in diligence |
|---|---|---|---|---|
| Consultants | Portfolio reporting design | Revenue, EBITDA, cash flow, leverage, value-creation tracking | Monthly or quarterly | KPI definitions, benchmark method, reporting model |
| Operating partners | Company performance fixes | Driver KPIs, root-cause metrics, milestone follow-through | Weekly or monthly | Line ownership, issue handling, pace of action |
| PMI firms | Post-close integration | Synergies vs. plan, one-time costs, retention, migration | Weekly | Workstream control, savings proof, escalation path |
| Fractional tech leaders | Reporting reliability | System data, reconciliation, latency, incidents, controls | Daily to weekly reviews during fixes | Source-system grip, close process, data controls |
If I were building a shortlist, I’d rank providers by fit to the metric failure, data access, and reporting cadence - not brand. A simple buyer list could look like this:
- A specialist with direct PE portfolio KPI and board-reporting work
- DevriX
- A PMI-led firm for post-close synergy programs
- A fractional CIO/CTO provider for source-system and reporting-control fixes
The practical takeaway is blunt: do not hire a reporting architect to solve an execution problem, and do not hire an execution lead to clean up bad source data. When the mandate is clear, the metric set gets smaller, the board pack gets cleaner, and accountability is easier to assign.
How each advisor type approaches portfolio metrics
Each advisor type owns a different part of the metric stack: framework, execution, integration, or data reliability.
Consultants and operating partners: framework design vs. operating action
Consultants set the metric architecture. Operating partners use it to change performance. That split matters because firms often expect one group to do both, and the work is not the same.
Consultants define shared KPI terms, set calculation rules, normalize reporting across portfolio companies, benchmark performance, and link metrics to the investment thesis and value-creation plan.[7] That includes things like defining organic revenue growth the same way across the portfolio so board reporting is comparable.
Operating partners work at the execution layer. Their focus is monthly operating data - revenue bridges, gross margin by segment, DSO, productivity, CAC, churn, and milestone completion - to find where performance is slipping and push corrective action.[2][5] If revenue misses plan, they break the gap into volume, price, mix, churn, and sales-conversion effects. Then each driver gets a named owner and a due date.
PMI firms: integration metrics tied to synergy delivery
PMI firms focus on deal execution and synergy delivery, not broad portfolio reporting. Their scorecards run on a different clock. In the first 100 days and the first year after close, the key metrics are synergies realized versus plan, one-time integration costs, recurring savings, system migration status, revenue synergy progress, and customer and key-employee retention.[3][6]
Track one-time integration costs separately from recurring savings.[6][8] If you blend those numbers together, the board gets a muddy view of what the deal is producing versus what it is consuming.
People metrics need another layer of detail. Segment retention by role and criticality. A headline retention figure can look fine while key managers or technical staff walk out the door. Those are often the hardest roles to replace.
Revenue synergies usually trail cost synergies because financial outputs lag the work inside the integration workstreams. So don't wait for reported revenue to tell you if the program is on track. Watch leading indicators such as joint proposals, cross-sell pipeline, and contract renewals.[3]
Fractional technology leaders: systems, data quality, and reporting reliability
Fractional CIOs and CTOs test whether the dashboard can be trusted. Their role is to assess whether the systems and data behind reporting are reliable, secure, and timely.[4] That means reviewing the application inventory, software spend, uptime, incidents, data completeness, reporting latency, cybersecurity remediation, and technical debt. If the source systems are weak, the KPI pack is weak too.
In practice, that may mean reconciling CRM bookings to the general ledger, finding duplicate customer records, or putting automated validation checks in place so exceptions get flagged before they hit the board deck. At this level, a data-quality scorecard may track the percentage of required fields populated, the number of unresolved reconciliation differences, and reporting latency.
Fractional technology leaders support decision quality by protecting the integrity of management and board reporting.
Use the comparison below to match advisor scope to the metric problem, data depth, and reporting cadence.
| Advisor type | Primary mandate | Common metrics | Cadence | Data depth | Primary support |
|---|---|---|---|---|---|
| Consultants | Design the measurement framework | Revenue, EBITDA, cash conversion, leverage, value-creation milestones | Quarterly | Portfolio-wide | KPI governance, benchmarking, target setting |
| Operating partners | Improve execution with management | Revenue bridges, gross margin by segment, DSO, productivity, CAC, churn, milestone completion | Monthly / weekly | Company-level drivers | Root-cause analysis, corrective actions, operating cadence |
| PMI firms | Deliver integration and synergies | Synergies vs. plan, one-time costs, recurring savings, migration status, customer and key-employee retention | Weekly during integration | Workstream and deal-level | Integration governance, synergy validation, workstream escalation |
| Fractional technology leaders | Make reporting reliable and measurable | Software spend, uptime, incidents, data completeness, reporting latency, cybersecurity remediation, technical debt | Ongoing | System and data layer | Data governance, systems rationalization, automation, reporting reliability |
Advisor comparison: scope, data depth, cadence, and decision support
The key difference is the decision each advisor is there to support. That is what should drive the choice.
Consultants answer what to measure and how to benchmark it. Operating partners answer what has to change this month. PMI firms answer whether the deal is delivering the value in the underwriting case. Fractional technology leaders answer whether the numbers can be trusted. Mix up those roles, and metric programs slow down fast.
Data depth is different too. Consultants usually work from financials and benchmark data. Operating partners work from company-level business drivers. PMI firms work from workstream evidence. Fractional technology leaders work from source systems and controls - the layer that turns reporting into something management and the board can actually use.
Cadence follows urgency. Consultants usually review monthly or quarterly. Operating partners stay close to weekly priority work. PMI firms often run weekly integration reviews. Fractional technology leaders run frequent remediation checks and reporting-close reviews.
When each advisor is the right fit
Match the advisor to the gap, not the title. A simple screen makes that easier:
- Five portfolio companies reporting EBITDA differently? Use a consultant to define the metric canon, standardize add-backs, and normalize reporting before the next board review.
- One company has an approved value-creation plan but keeps missing milestones? Use an operating partner to run weekly execution oversight, break the gap down by driver, and assign named owners with due dates.
- A recently acquired company is expected to generate procurement and back-office savings? Use a PMI firm to set the synergy baseline, assign workstream owners, and track realized savings apart from planned or annualized benefits.
- Management reporting takes 3 weeks because ERP, CRM, and billing data do not reconcile? Use a fractional technology leader to fix data flows and controls before the sponsor uses that dashboard for any major decision.
The mismatch is straightforward: do not use a strategy advisor to fix systems, and do not use a reporting-only provider to drive operating accountability. The next step is turning the chosen advisor’s role into a working metric system.
How to build a working portfolio metric system
Start with the investment thesis and separate outcomes from leading indicators
Build the metric system off the deal thesis, not off whatever data happens to be easy to pull. If a metric does not test a core deal assumption, it probably does not belong on the main dashboard.
Start with the few assumptions that the investment case depends on. Then assign metrics that show whether those assumptions are holding up. If the thesis was pricing improvement, the dashboard should track realized price, discount incidence, win rate, volume, and gross margin - not just revenue. If the thesis was procurement savings, it should track contracted savings, realized savings, and the gap between them. The value-creation plan should also tie each initiative to an owner, a timeline, and the expected financial impact.[1][10]
From there, split metrics into 2 groups: outcomes and leading indicators. Outcomes tell you what already happened. Leading indicators help you see what is likely to happen next.
At the board level, keep the dashboard tight. In many cases, that means 5 to 7 core metrics. The monthly package can go a bit deeper with 8 or fewer priority operating KPIs, plus a tracker for the 3 to 5 initiatives that matter most. That gives directors both views they need: a look back at performance and an early warning when intervention may be needed.[9][11]
Define ownership, formulas, source systems, and escalation rules
If you want the dashboard to drive action, define every metric the same way every time. The cleanest way to do that is with a KPI dictionary.
For each KPI, document:
- the question it answers
- the formula
- the unit
- the source system of record
- the metric owner
- the data owner
- the reporting cadence
- the target
- the action threshold
This cuts down on debates in board prep and makes reporting repeatable.[12]
Escalation rules also need to be set ahead of time. Do not use one blanket percentage across the whole portfolio. Thresholds should reflect the company’s volatility and covenant position. For example, revenue that lands more than 5% below plan may trigger a written explanation and a forecast update. A cash-conversion-cycle increase of more than 10 days may trigger a working-capital action plan.[11][14]
Spell out who investigates, by when, and what decision rights switch on. That is the difference between a dashboard that just reports bad news and one that helps management deal with it.
Standardize portfolio-wide reporting while keeping company-level KPIs
Standardize the reporting spine across the portfolio, but do not standardize every operating KPI. The goal is comparability where it matters, without flattening the economics of very different business models.
A common portfolio spine should cover revenue growth, adjusted EBITDA and margin, cash flow, net debt, leverage, headcount, and the status of the value-creation plan. That gives sponsors a consistent view across companies. Standardization should also include definitions, formulas, source mapping, reporting dates, currency treatment, and data-quality status.[13]
Keep company-level KPIs tied to the operating model. Software, manufacturing, and services businesses should not be forced into the same operating metric set. That usually creates noise, not insight. Differences in accounting policy, fiscal calendars, acquisition scope, and organic versus acquired performance should be labeled clearly so the portfolio view stays clean.[13]
Conclusion: Matching the Advisor to the Metric Problem
Match the advisor to the metric failure. Don’t start with the title. Start with the job the metrics need to do.
Consultants fix definitions and reporting structure. Operating partners turn metrics into action. PMI firms track integration and synergies. Fractional technology leaders fix data reliability. Those are different problems, and they sit in different layers of the metric stack.
Sponsors often use more than 1 advisor at the same time, but each one should own a single layer. That keeps accountability clear and cuts down on overlap, delay, and reporting noise.
Before selecting a firm, define what the metrics must support. Is the issue board reporting, value creation tracking, post-close integration, or source-of-truth data? Set that mandate first, then match the advisor to it, and build the metric system around that mandate.
Use the Top Consulting Firms Directory to shortlist PE consultants, operating partners, M&A integration consultants, and due diligence firms by mandate.
FAQs
How do I know which advisor type I need first?
Start with your growth stage and the main operational gaps you need to fix. That should drive the decision.
If you need flexible funding and hands-on mentorship early on, angel investors may be the better first fit. If you already have traction and need more structured support to scale, venture capital may make more sense.
For operational or technical needs, screen advisors based on:
- Industry expertise
- Technical skill
- Their ability to deliver actionable, data-driven insight
You can also use the Top Consulting Firms Directory to narrow your search.
Can one advisor handle both execution and data issues?
Yes - if the advisor handles end-to-end implementation. The point is not just to refine KPIs and benchmarks. It is to make sure data collection, integration, validation, and reporting work in practice.
The articles describe consultants covering both sides of the job. On the data side, that includes quality checks and source validation. On the execution side, it includes setting processes, building dashboards, and establishing accountability for ongoing tracking and action.
What metrics should go in a PE board dashboard?
Use a small board KPI set tied to SMART objectives. For most companies, that means 5-7 total KPIs, with 2-3 KPIs per goal at most. The point is control, not clutter. If the board pack has 20 metrics, the signal gets lost.
Cover the core value drivers the board will expect to see:
- Financial performance
- Operational efficiency
- Service delivery
- Business development
- Talent management
- Client impact
For each KPI, show the target, actual, and trend. A simple view works best: current month or quarter, year-to-date, prior-period comparison, and direction of travel. Boards need to know fast: Are we on plan, off plan, or drifting?
A practical scorecard might look like this:
| Area | KPI | Target | Trend View |
|---|---|---|---|
| Financial performance | Revenue growth, EBITDA margin | vs. budget and prior year | Monthly and quarterly trend |
| Operational efficiency | Gross margin, utilization, cycle time | plan thresholds | Rolling 3- to 6-month trend |
| Service delivery | On-time delivery, SLA attainment | contracted or internal target | Monthly trend |
| Business development | Qualified pipeline coverage, win rate | coverage ratio and conversion target | Rolling quarterly trend |
| Talent management | Voluntary attrition, time-to-fill | hiring and retention plan | Monthly trend |
| Client impact | Net revenue retention, client satisfaction | account plan target | Quarterly trend |
Use real-time or regularly updated scorecards where the business supports it. In fast-moving operating environments, stale data is almost as bad as no data. If a metric only updates quarterly, be clear about that and avoid mixing it with daily or weekly operating signals without context.
If ESG is material to the business, include investor-grade ESG metrics that tie to financial outcomes. Keep it tight. Focus on measures that affect revenue durability, cost structure, risk, compliance, insurance, labor stability, or exit value. Don’t add ESG slides just to check a box. Add metrics the board can use.