Integrated dashboards simplify teamwork by consolidating data from various systems into one accessible platform. They help eliminate confusion, align priorities, and improve communication across departments. Tools like HockeyStack, ClickUp, and Microsoft Power BI offer unique features tailored to different organizational needs:
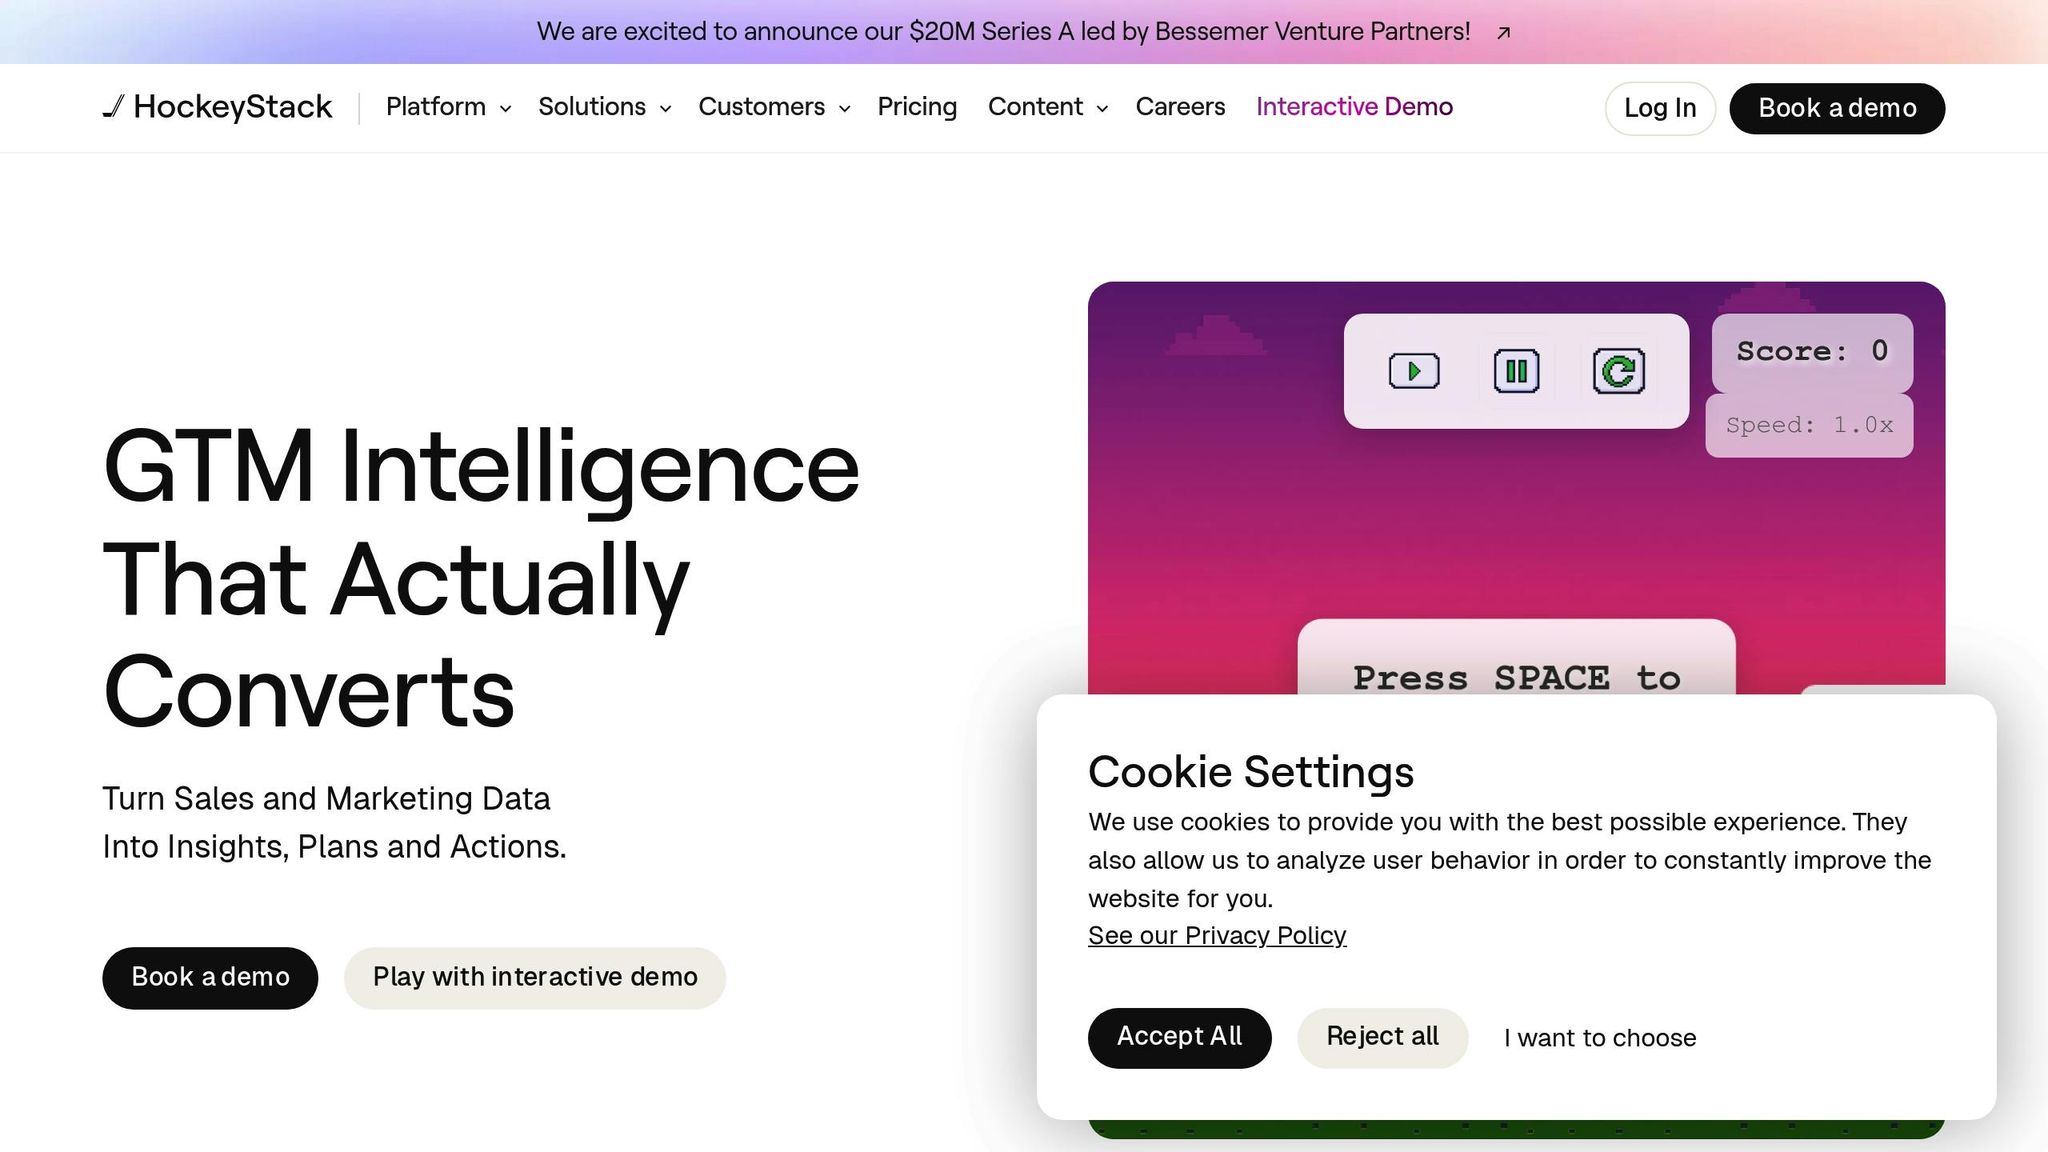
- HockeyStack: Best for marketing and sales teams, with a focus on revenue tracking and customer journey insights.
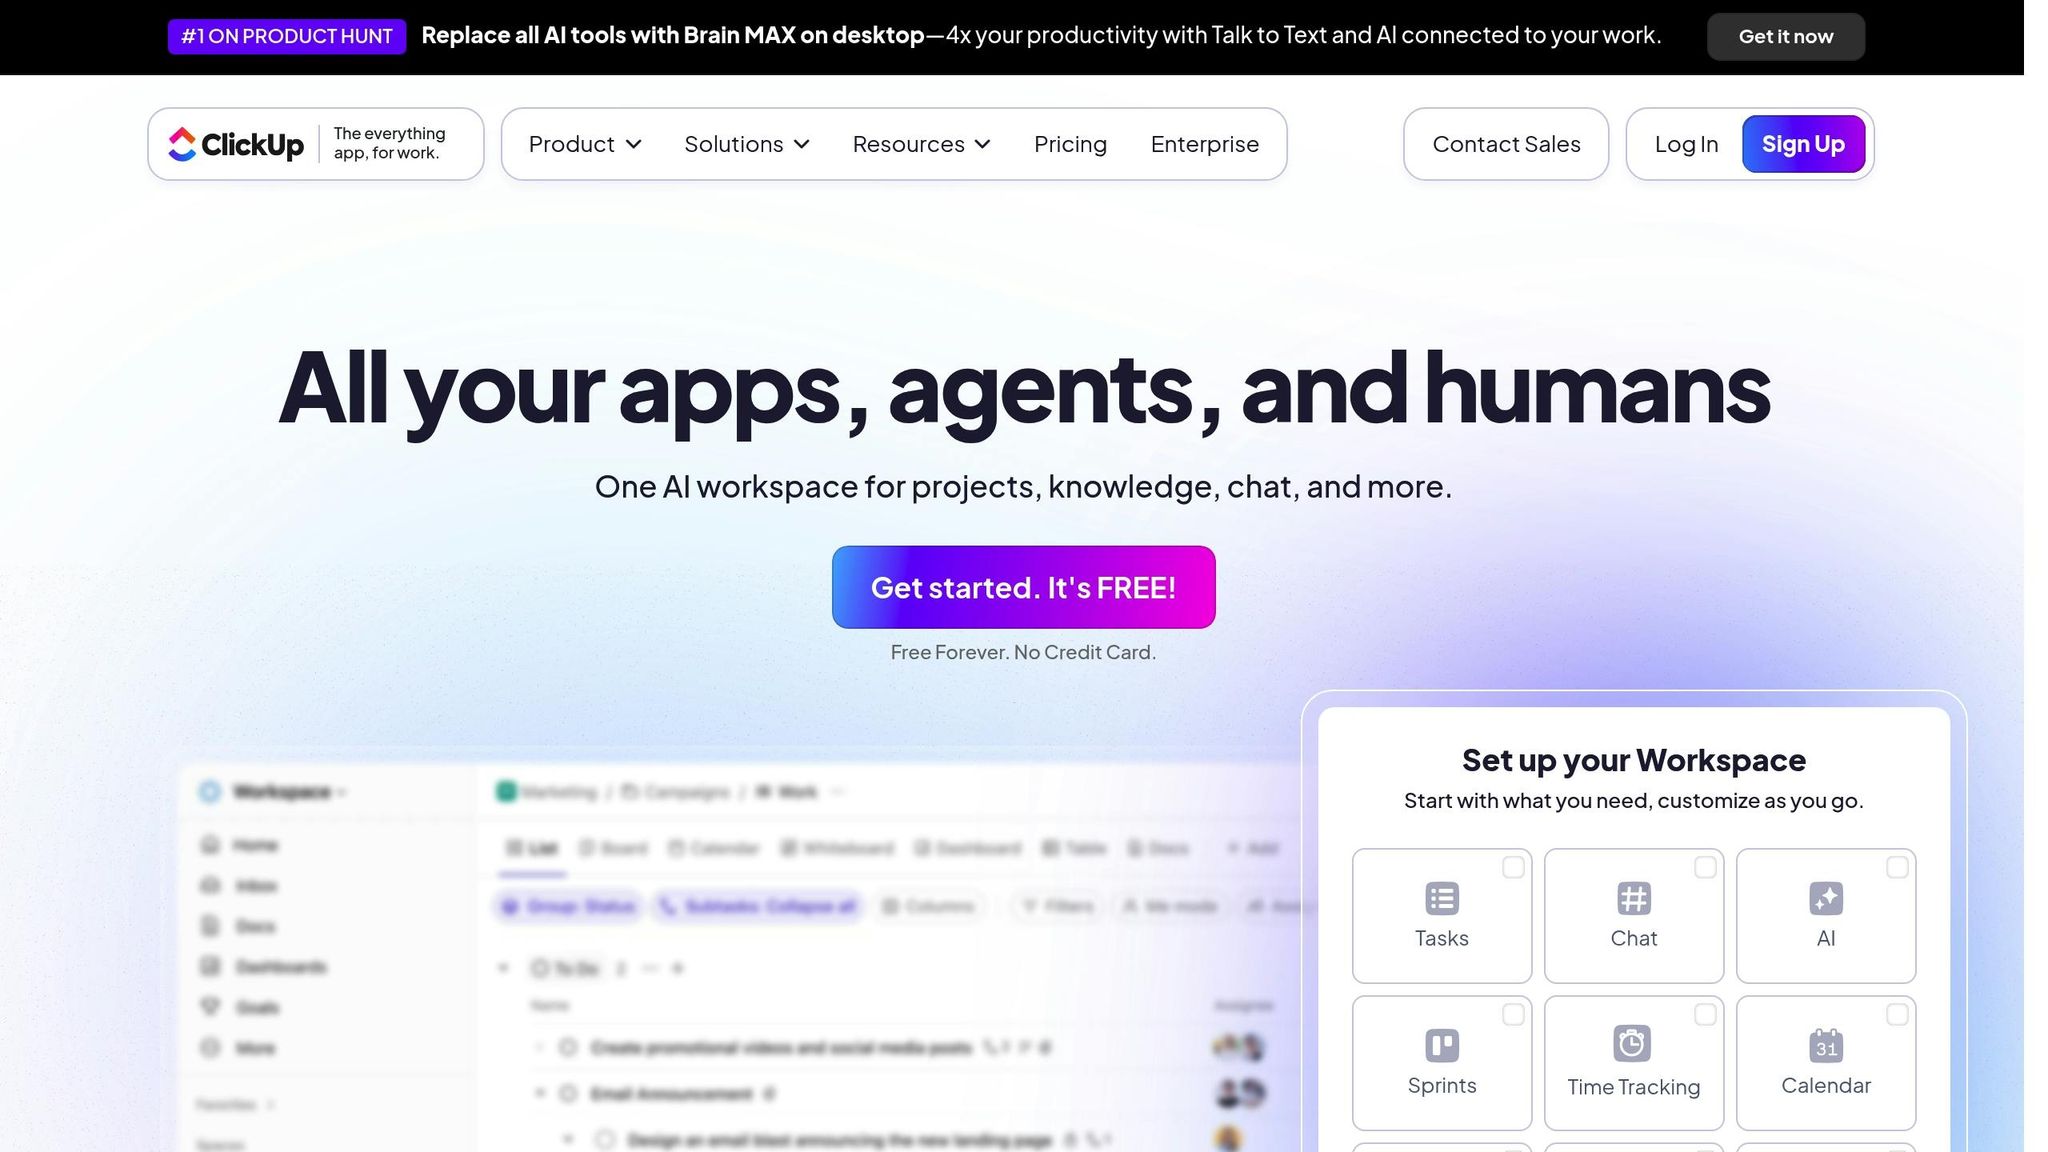
- ClickUp: Ideal for cross-functional teams, combining project management with collaborative dashboards.
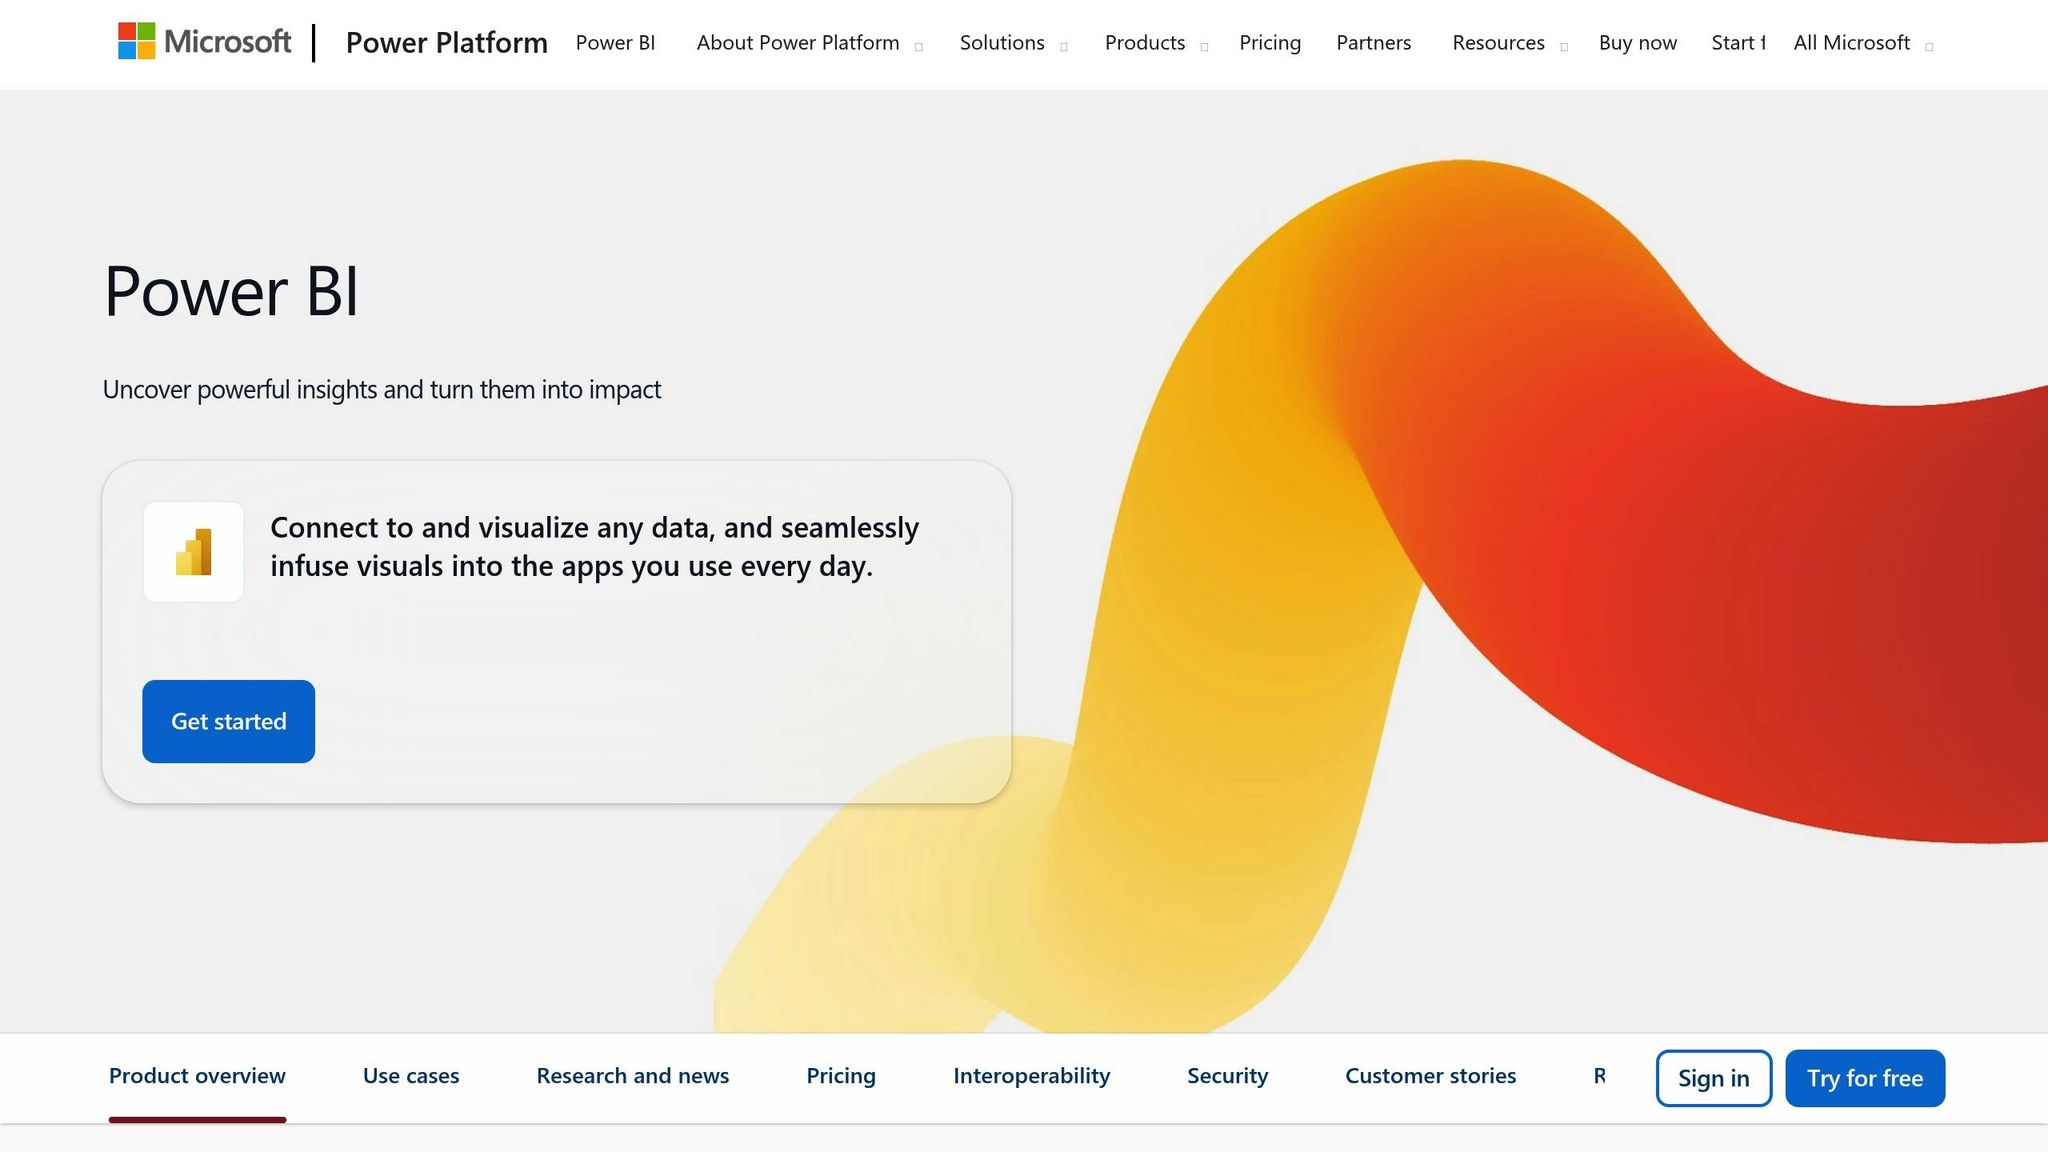
- Microsoft Power BI: Suited for data-driven enterprises, integrating large-scale data for comprehensive analysis.
Quick Comparison
| Feature | HockeyStack | ClickUp | Microsoft Power BI |
|---|---|---|---|
| Strength | Marketing attribution & ROI | Project management & tracking | Enterprise data analytics |
| Best For | Marketing & sales teams | Cross-functional projects | Data-heavy organizations |
| Ease of Setup | Moderate | Complex | Complex |
| Learning Curve | Moderate | Steep | Steep |
| Integration Scope | Marketing & sales tools | Wide range of apps | Enterprise-wide systems |
| Real-Time Updates | Yes | Yes | Yes |
Each platform caters to specific needs. Choose based on your team's focus, technical expertise, and collaboration goals.
ClickUp Tutorial | Dashboard for Team Collaboration

1. HockeyStack

HockeyStack is a revenue operations platform designed to bring together data from marketing, sales, and customer success teams. It places a strong emphasis on attribution modeling and pipeline visibility, making it a go-to option for teams looking to follow the customer journey from the first interaction to a closed deal.
Data Integration
HockeyStack integrates seamlessly with over 70 tools, including Salesforce, HubSpot, Google Analytics, Facebook Ads, and Stripe. The platform auto-updates hourly, ensuring teams always have access to the latest data. Its no-code integration is a standout feature, allowing users to connect new tools without needing technical expertise or developer support.
One of its key strengths lies in cross-channel attribution, which shows how different marketing touchpoints contribute to revenue. For example, marketing teams can track how a LinkedIn ad impression, followed by an email click, eventually leads to a sales call and a closed deal. This detailed tracking helps teams understand their combined influence on business outcomes.
In addition to consolidating data, HockeyStack promotes collaboration with features designed to bring teams together.
Collaboration Tools
HockeyStack enables teams to work in shared workspaces, where departments can access the same datasets but focus on metrics relevant to their roles. For instance, sales teams might analyze pipeline velocity, while marketing teams examine lead quality and conversion rates - all from the same data source. This ensures everyone is aligned and interpreting the data consistently.
The platform also includes annotation features, allowing team members to add notes directly to charts and graphs. If a marketing campaign causes an unexpected spike in leads, users can document details about the campaign right on the dashboard. These annotations serve as a valuable resource for future decisions.
Additionally, automated alerts notify relevant teams when critical metrics hit predefined thresholds. For example, if the cost per acquisition exceeds budget limits, both marketing and finance teams are alerted immediately, enabling quick action and better coordination.
Customization Features
HockeyStack provides users with the ability to create tailored dashboards using a simple drag-and-drop interface. Reporting periods can also be customized to suit each team's workflow.
The platform offers flexible reporting periods, making it easy to adapt to different business rhythms. Sales teams often focus on monthly or quarterly cycles, while marketing teams may need insights on a weekly or even daily basis. This flexibility allows each team to work with the time frames that best suit their needs without impacting others.
Accessibility
HockeyStack is accessible on both desktop and mobile devices, making it easy to share live dashboards during presentations. Instead of relying on static screenshots, teams can present dynamic charts that update in real time, ensuring stakeholders always see the most current data during meetings.
The platform also includes role-based permissions, which provide controlled access to data while maintaining transparency. For example, finance teams can view detailed cost breakdowns, while other departments see high-level performance metrics. This approach ensures sensitive information remains secure while still fostering collaboration across teams.
2. ClickUp
ClickUp is more than just a project management tool - it now offers integrated dashboards designed to enhance collaboration across departments. While it’s widely recognized for task management, its dashboard features make it easy for teams to visualize data, track performance metrics, and stay aligned, all within a single workspace.
Data Integration
ClickUp connects with over 1,000 tools, including Slack, Google Workspace, Microsoft Teams, Salesforce, and Zapier. This extensive integration capability allows it to gather data from various sources and present it in unified dashboards that multiple teams can access at once.
One standout feature is real-time data synchronization. For instance, if the sales team updates a deal status in their CRM, the marketing team can immediately see how it impacts campaign metrics on ClickUp’s dashboard. This instant data flow eliminates the delays often caused by siloed systems.
With the custom fields feature, teams can capture specific data tailored to their needs. Marketing teams might track campaign attribution, while sales teams monitor deal progression. These datasets can then be combined to create a holistic view, such as a complete customer acquisition funnel. This level of integration lays the groundwork for seamless collaboration.
Collaboration Tools
ClickUp’s dashboards support department-specific views, ensuring each team sees the metrics most relevant to them without losing sight of the bigger picture. Teams can filter data as needed, giving them quick access to actionable insights.
The platform also includes widgets that support commenting and tagging, making it easy for teams to discuss specific data points in real time. For example, during monthly business reviews, multiple departments can engage in discussions about interconnected metrics, keeping everyone on the same page.
Automated reporting is another helpful feature. Teams can schedule periodic dashboard snapshots tailored to different audiences. Executives can receive high-level summaries, while operational teams get detailed breakdowns, ensuring everyone has the right information at their fingertips.
Customization Features
ClickUp’s drag-and-drop dashboard builder makes it easy to set up custom layouts. Teams can create widgets in formats like charts, tables, progress bars, or even custom calculations. This flexibility allows each department to tailor dashboards to their specific reporting needs while still relying on shared data sources.
The platform’s goal tracking tools are particularly useful for aligning team objectives. For example, marketing, sales, and customer success teams can all contribute to shared revenue goals. Dashboards provide a clear view of each department’s contributions, showing how individual efforts impact overall performance.
With time-based filtering, teams can analyze data across different timeframes, whether it’s daily operations or quarterly performance reviews. This adaptability supports the varying reporting cycles different departments follow, ensuring everyone remains aligned with organizational goals.
Accessibility
ClickUp’s mobile apps for iOS and Android ensure full dashboard access on the go. Field teams and remote workers can interact with data just as they would on a desktop, making it easier to stay connected to key metrics no matter where they are.
The platform also offers permission controls, allowing admins to manage who can view, edit, or share specific dashboard elements. This ensures sensitive data stays secure while still enabling broad collaboration on operational metrics.
For external stakeholders, ClickUp provides guest access options, allowing clients or partners to view specific dashboards without exposing internal systems. This feature is particularly useful for maintaining transparency while safeguarding sensitive information.
sbb-itb-97f6a47
3. Microsoft Power BI

Microsoft Power BI is a powerful platform designed to bring all your business data together in one place. With its interactive dashboards, it provides a clear, unified view of key performance metrics, helping teams make smarter, faster decisions.
Data Integration
One of Power BI's standout features is its ability to pull data from multiple departmental systems into a single, cohesive dashboard. This integration allows teams to access and analyze real-time information across the organization, creating opportunities for better collaboration and alignment.
Collaboration Tools
Beyond data integration, Power BI makes teamwork easier with its sharing capabilities. Dashboards and reports can be shared effortlessly, ensuring everyone is working from the same up-to-date information. This shared access helps break down barriers between departments, enabling teams to communicate effectively and respond quickly to new developments.
Advantages and Disadvantages
Integrated dashboard solutions come with their own set of strengths and challenges, especially when it comes to fostering collaboration across departments. By weighing these trade-offs, organizations can better identify the platform that aligns with their goals and team dynamics. Here's a breakdown of the key benefits and limitations of three popular platforms.
HockeyStack is a standout choice for marketing teams, offering in-depth attribution tracking and insights into the customer journey. Its ability to tie marketing efforts directly to revenue makes it a go-to for businesses focused on growth metrics. However, its features are heavily tailored to marketing and sales, which might leave other departments with fewer tools relevant to their daily needs.
ClickUp shines when it comes to project management and task coordination across teams. Its highly customizable workflows and ability to integrate various business functions make it a strong option for organizations needing a blend of project tracking and collaboration tools. That said, this flexibility can add a layer of complexity, requiring significant setup and ongoing management to keep workspaces organized.
Microsoft Power BI is a powerhouse for data integration, capable of pulling information from nearly any system into unified dashboards. With enterprise-grade security and seamless integration with Office 365 and Azure, it’s a natural fit for data-driven organizations. However, its advanced features come with a steep learning curve, often requiring technical expertise to build and manage dashboards effectively.
Here’s a side-by-side comparison of the platforms:
| Feature | HockeyStack | ClickUp | Microsoft Power BI |
|---|---|---|---|
| Primary Strength | Marketing attribution & ROI tracking | Project management & task collaboration | Data integration & business intelligence |
| Best For | Marketing & sales teams | Cross-functional project teams | Data-driven organizations |
| Setup Complexity | Low to Medium | Medium to High | Medium to High |
| Learning Curve | Moderate | Steep | Steep |
| Customization | Focused on marketing metrics | Highly customizable workflows | Dashboard customization |
| Integration Scope | Marketing & sales tools | Wide range of business apps | Enterprise-wide data sources |
| Real-time Collaboration | Limited | Excellent | Good |
| Cost Consideration | Specialized pricing | Scales with team size | Enterprise licensing model |
Choosing the right platform depends on your organization’s priorities. For companies focused on marketing performance and attribution, HockeyStack offers a targeted solution that’s hard to beat. Teams managing complex, multi-departmental projects will appreciate ClickUp’s collaborative features, even if it demands more effort upfront. Meanwhile, data-heavy enterprises already using Microsoft’s ecosystem will find Power BI delivers unmatched value for large-scale analytics.
In terms of cost, HockeyStack is best suited for marketing-centric organizations, ClickUp’s per-user pricing adapts well to growing teams, and Power BI’s enterprise licensing becomes more economical for larger firms handling extensive data needs.
Conclusion
When deciding between HockeyStack, ClickUp, and Microsoft Power BI, the right choice depends on your organization's collaboration needs and technical expertise. For teams prioritizing advanced, customizable analytics alongside actionable market insights, HockeyStack stands out as a strong contender. It’s designed to handle growing data volumes effectively, but keep in mind that its steep learning curve and higher initial costs demand careful planning and resources. Additionally, performance may dip when working with extremely large datasets.
While HockeyStack excels in delivering detailed analytics for strategic decision-making, it’s important to weigh its features against those of ClickUp and Power BI. Each platform offers unique strengths, and the best fit will depend on your specific requirements for cross-departmental collaboration and data handling. HockeyStack shines in environments ready to embrace data-heavy processes, but its setup demands a team prepared for the challenge.
Ultimately, aligning your organization's technical capacity and collaboration goals with the strengths of these platforms will help you make the most of your dashboard investment.
FAQs
How do integrated dashboards help teams collaborate more effectively across departments?
Integrated dashboards bring teams together by gathering data from different departments into one simple, user-friendly platform. This shared view ensures that everyone is on the same page with accurate, current information, streamlining both communication and decision-making.
These dashboards also make reporting and analysis much easier, helping teams stay aligned and move toward their goals with fewer roadblocks. They play a key role in supporting data-driven strategies and boosting overall efficiency.
How do HockeyStack, ClickUp, and Microsoft Power BI compare in terms of setup complexity and ease of learning?
HockeyStack packs a punch when it comes to features, but it comes with a steep learning curve. Setting up advanced attribution models, in particular, can be tricky and time-consuming, requiring a solid level of expertise to get the most out of it.
ClickUp shines with its extensive customization options, but its sheer variety of features can feel overwhelming for newcomers. This makes the learning process moderately challenging, especially for those unfamiliar with such versatile tools.
Microsoft Power BI, on the other hand, is more approachable for beginners. Its drag-and-drop interface makes creating basic dashboards straightforward. That said, diving into advanced features like data modeling or DAX functions does require extra time and effort to master.
In short, Power BI is a smoother starting point, while HockeyStack and ClickUp demand more technical skills and time to unlock their full potential.
What should organizations consider when choosing an integrated dashboard platform to meet their goals?
When choosing an integrated dashboard platform, it's essential to consider data compatibility and scalability. Make sure the platform can handle widely-used data formats like JSON, XML, or CSV and works smoothly with your current systems.
Another critical factor is ease of use and customization. A platform with an intuitive interface and flexible dashboard options allows teams to analyze data efficiently and collaborate without hassle. Opt for solutions that provide self-service tools and align with your organization's metrics to support informed decision-making and long-term objectives.


