Hybrid forecasting merges statistical methods with machine learning to improve prediction accuracy. Statistical models like ARIMA excel at identifying linear trends and seasonality, while machine learning models such as LSTM and XGBoost detect complex, nonlinear patterns. By combining these approaches, hybrid forecasting overcomes the limitations of each, offering better results for diverse datasets.
Key Points:
- Statistical Models: Handle linear patterns, trends, and seasonality; work well with small datasets.
- Machine Learning Models: Detect nonlinear patterns but need large datasets and can be resource-intensive.
- Hybrid Approach: Blends both methods to capture linear and nonlinear relationships, improving forecast accuracy.
For example, the ES-RNN model, which won the M4 Competition, combines exponential smoothing (for seasonality) with LSTM (for trends) to outperform single-method models. In a 2026 study, hybrid models reduced RMSE by up to 92.9% compared to ARIMA alone.
Benefits of Hybrid Forecasting:
- Works with smaller datasets while addressing complex data patterns.
- Balances interpretability (from statistical models) and flexibility (from machine learning models).
- Reduces errors in industries like e-commerce, energy, finance, and healthcare.
Hybrid forecasting is especially useful when data exhibits both linear and nonlinear characteristics or when accuracy is critical for decision-making.
TS-9: Hybrid methods for time series
sbb-itb-97f6a47
Statistical Models vs. Machine Learning vs. Hybrid Forecasting
Statistical vs Machine Learning vs Hybrid Forecasting Models Comparison
Statistical Models: Strengths and Weaknesses
Statistical models like ARIMA and Holt-Winters are great for identifying linear relationships and seasonal patterns. They shine when working with smaller datasets, thanks to their low computational demands and ability to deliver consistent, reliable results.
That said, these models come with limitations. They assume linear relationships and stationarity, which makes them less effective when dealing with sudden changes or complex, nonlinear patterns in data. As Yue Li from Bain & Company's Advanced Analytics practice notes:
"Statistical models usually have better explanatory power because they demonstrate how the forecast variable projects out or how causal factors drive the forecast variable in an explicit form."
Next, let’s see how machine learning models address these gaps while introducing some challenges of their own.
Machine Learning Models: Strengths and Weaknesses
Machine learning models like LSTM and CNN excel at identifying intricate, nonlinear patterns that statistical models can’t handle. They can also analyze multiple time series together, leveraging cross-series relationships to boost forecast accuracy. This makes them particularly useful for datasets with hidden or complex connections.
However, machine learning models have their own challenges. They require large datasets to avoid overfitting and perform well. Their "black box" nature makes them difficult to interpret without additional tools like SHAP. Plus, they are resource-intensive and often struggle with trend extrapolation. Research even suggests that when sample sizes are very small, simple statistical models often outperform these advanced methods.
How Hybrid Forecasting Combines Both Approaches
Given the complementary strengths and weaknesses of statistical and machine learning models, hybrid forecasting offers a way to combine their advantages. This approach blends the stability and interpretability of statistical models with the flexibility and pattern-detection capabilities of machine learning.
In practice, hybrid forecasting uses statistical models to capture linear trends and seasonality, while machine learning models refine the results by addressing residual nonlinear patterns. This combination provides a reliable baseline that’s easy to interpret, while still offering advanced capabilities for handling complex data.
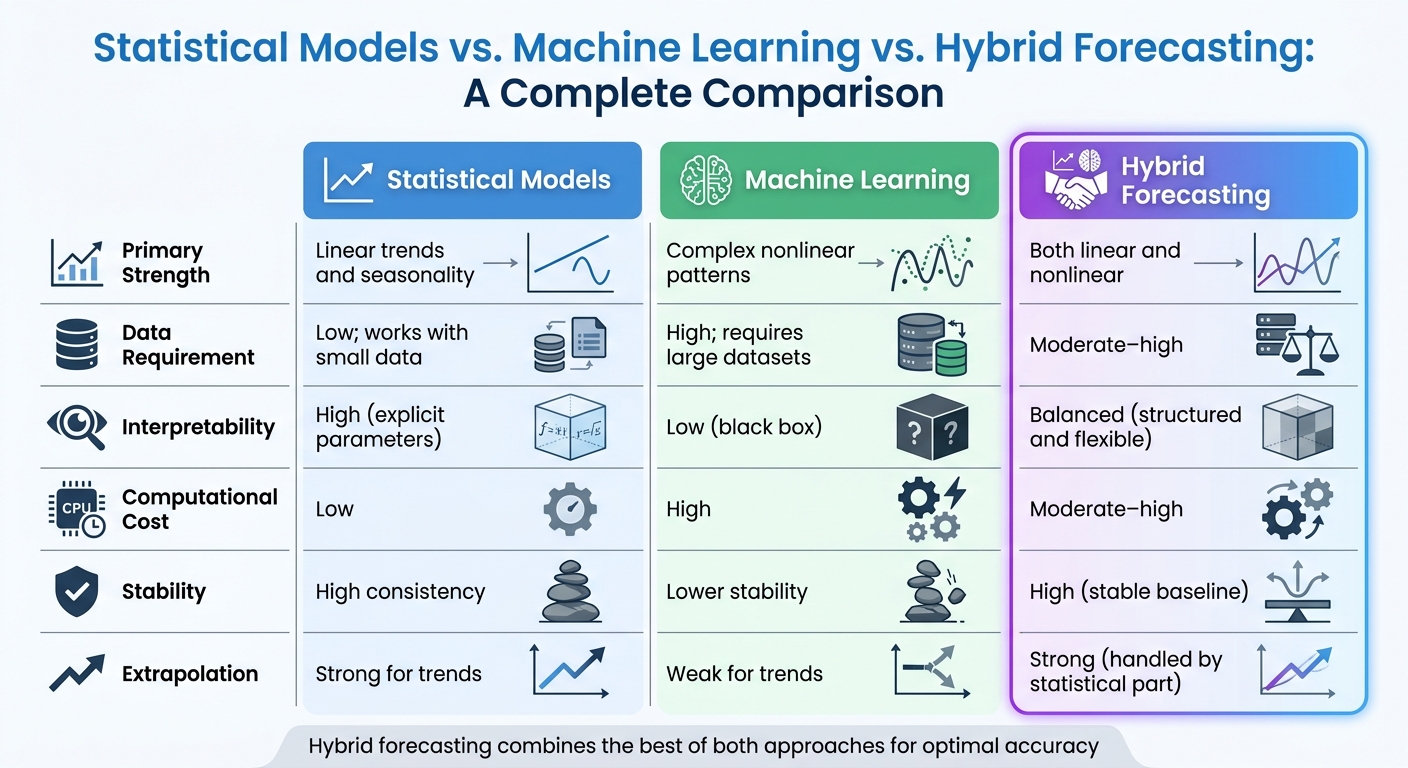
Here’s a quick comparison of the three approaches:
| Feature | Statistical Models | Machine Learning | Hybrid Forecasting |
|---|---|---|---|
| Primary Strength | Linear trends and seasonality | Complex nonlinear patterns | Both linear and nonlinear |
| Data Requirement | Low; works with small data | High; requires large datasets | Moderate–high |
| Interpretability | High (explicit parameters) | Low (black box) | Balanced (structured and flexible) |
| Computational Cost | Low | High | Moderate–high |
| Stability | High consistency | Lower stability | High (stable baseline) |
| Extrapolation | Strong for trends | Weak for trends | Strong (handled by statistical part) |
Hybrid forecasting is particularly useful when your data exhibits both linear and nonlinear characteristics, when interpretability is key, or when working with smaller datasets that still include complex relationships .
Common Hybrid Forecasting Techniques
Residual Modeling
Residual modeling works by breaking down a time series into its linear and nonlinear components. First, a statistical model handles the linear trends and autocorrelation. Then, a machine learning model steps in to model the residuals, capturing the nonlinear patterns. Finally, the outputs from both models are combined to produce the final forecast.
"The MLP learns the deviation of the ARIMA prediction from the actual value and seeks to adjust it to obtain a more accurate result." - Daniel Berberich
This approach has shown strong results in financial forecasting. For instance, a study analyzing 5,536 daily S&P 500 observations (2002–2023) demonstrated that combining ARIMA with models like SVM or LSTM consistently outperformed using any single model alone. Interestingly, using the statistical forecast as an input feature allows the machine learning model to capture intricate relationships, enhancing overall accuracy.
Let’s now dive into another hybrid method that blends multiple models for improved accuracy.
Weighted Average Ensemble (WAE)
The Weighted Average Ensemble method combines forecasts from different models by assigning them specific weights. These weights, which sum to 1.0, ensure a balanced and unbiased prediction. When two models have uncorrelated errors and identical error variances, the ideal weight for each is 0.5.
There are several ways to assign weights:
- Equal weights: A straightforward averaging approach, useful when models perform similarly.
- Inverse error weighting: Gives more weight to models with lower error metrics, such as RMSE or MAE.
- Optimal variance weighting: Minimizes the combined error by factoring in the correlations between model errors.
To ensure reliable forecasting, weights should be determined using cross-validation errors rather than in-sample errors. Cross-validation provides a better measure of how models will perform on unseen data.
Next, we’ll look at how neural networks can refine forecasts through a hybrid technique called ES-RNN.
ES-RNN: A Hybrid Approach
ES-RNN merges exponential smoothing with LSTM to address both seasonality and complex trends. Exponential smoothing handles the seasonality and level for each time series, while the LSTM component captures shared trends and nonlinear patterns across the dataset. The process involves de-seasonalizing and normalizing the data using exponential smoothing parameters before feeding it into the RNN. The final forecast is then re-seasonalized.
This method gained significant recognition by winning the M4 forecasting competition in 2018, outperforming 60 other approaches across 100,000 time series. ES-RNN shines in large-scale forecasting tasks with clear seasonality and intricate nonlinear trends, as long as the periodicity (e.g., daily, monthly, yearly) is accurately defined.
How to Implement Hybrid Forecasting: Step-by-Step Guide
Step 1: Prepare Your Data
Start by gathering all the necessary data sources - sales history, promotion calendars, product catalogs, weather data, marketing spend, and competitor pricing. For example, an e-commerce team transitioning to hybrid forecasting in 2026 used data from six different sources to cover 3,200 active products in their catalog.
Next, focus on feature engineering. Create lag features (e.g., sales from 1, 7, or 28 days ago), calculate rolling averages and standard deviations over 28-day windows, and extract calendar features like day of the week, month, and holidays. Use sine/cosine transforms to capture cyclical patterns. Don’t forget to include external variables such as discount percentages, temperature changes, and competitor price ratios.
Before feeding data into machine learning models, normalize it (e.g., with MinMaxScaler) to maintain stability. Avoid data leakage by ensuring all features use a minimum 7-day shift, keeping future information out of the training set. Handle missing data by imputing values or dropping incomplete rows, but be mindful of zero-sales days, especially for products with sporadic demand. Use temporal cross-validation with expanding or sliding windows to maintain the chronological integrity of your data.
Step 2: Build a Statistical Baseline
Once your data is ready, establish a baseline using a statistical model such as ARIMA or exponential smoothing. These models are great for identifying linear trends and seasonal patterns, even with limited data.
In R, tools like forecastHybrid can simplify this process by combining models such as auto.arima, ets, thetam, and nnetar. This baseline becomes your benchmark - if your hybrid model doesn’t outperform it, the added complexity might not be worth it.
Step 3: Add Machine Learning Models
With the statistical baseline in place, train machine learning models like XGBoost, LightGBM, or LSTM. These models can either work on the residuals (errors from the statistical model) or the full dataset. Machine learning shines in identifying nonlinear patterns, such as demand spikes during promotions or intricate variable interactions.
Step 4: Combine the Forecasts
Merge the outputs from the statistical and machine learning models through weighted averaging. Start with equal weights (0.5 for each model) as a baseline. To improve accuracy, use inverse error weighting, assigning greater importance to models with lower RMSE or MAE.
For a more advanced approach, try cross-validation-based weighting, which optimizes weights based on out-of-sample performance. Adaptive ensemble weighting can also adjust model contributions dynamically based on current performance.
There are two main strategies for combining models. In additive hybrids, the machine learning model is trained to fit the residuals of the statistical forecast. In inclusive hybrids, the statistical forecast is used as a feature that the machine learning model can refine. The latter often performs better by correcting errors in the initial trend estimate.
Once the forecasts are merged, evaluate their accuracy to complete your hybrid setup.
Step 5: Evaluate and Optimize Performance
Use metrics like Mean Absolute Scaled Error (MASE) to assess forecasting performance. MASE works well because it’s scale-independent and compares your model against a naive baseline. Weighted Absolute Percentage Error (WAPE) is another useful metric for business applications, especially for series with zero values. Avoid Mean Absolute Percentage Error (MAPE), as it can fail with small or zero values.
| Metric | Best Use Case | Potential Pitfall |
|---|---|---|
| MASE | Comparing across different scales/series | Harder to explain to non-technical stakeholders |
| WAPE | Business-friendly; handles zero values | Can be biased by high-volume items |
| RMSE | Penalizes large outliers | Scale-dependent; sensitive to outliers |
| MAPE | Intuitive percentage-based error | May become undefined for small or zero values |
Set up monitoring systems to detect concept drift - when forecast error patterns shift significantly from validation performance. For example, the e-commerce team mentioned earlier reduced their stockout rate from 14% to 10.1% and cut excess inventory from $2.3 million to $1.41 million over two years by implementing monitoring and retraining protocols. They also slashed forecast generation time by 95%, going from 4 hours to just 12 minutes.
Finally, perform sanity checks to ensure predictions make sense - no negative values, reasonable ranges based on historical data, and full SKU coverage. Establish a retraining schedule based on your data’s volatility. This could be weekly, monthly, or triggered by error thresholds. For highly dynamic datasets, you might even consider incremental online learning.
Applications and Benefits of Hybrid Forecasting
Industry Applications
Hybrid forecasting has found its way into industries where precision directly impacts profitability. For example, in e-commerce and retail, businesses rely on these models to manage inventory for thousands of items while factoring in variables like promotions, competitor pricing, and even weather conditions. Similarly, energy and utilities sectors use hybrid frameworks to predict power loads and daily gas demand, helping maintain grid stability. In manufacturing and supply chain operations, particularly in sectors like semiconductors and home appliances, hybrid models address the challenges of fluctuating and unpredictable demand.
The finance sector employs hybrid forecasting for tasks like inflation prediction, GDP growth estimates, and stock price analysis. These models effectively capture both steady trends and unexpected market fluctuations. Meanwhile, healthcare and pharmaceutical companies use these methods to predict vaccine demand and daily sales, incorporating variables such as holiday seasons, promotions, and stock levels.
| Industry | Specific Application | Hybrid Components Used |
|---|---|---|
| E-commerce | Inventory & stockout reduction | LightGBM + Prophet + Feature Engineering |
| Semiconductor | IC tray demand prediction | ARIMA + LSTM |
| Energy | Electricity & gas load | SARIMA + LSTM / XGBoost |
| Finance | Inflation & economic indicators | DL (CNN/RNN) + ML (XGBoost) + Statistical (Prophet) |
| Pharmaceutical | Daily sales & promotions | Holt-Winters + XGBoost |
These examples highlight how hybrid forecasting adapts to meet the unique needs of various industries, delivering actionable insights.
Business Benefits
The financial impact of hybrid forecasting is hard to ignore. For instance, an early 2026 case study in e-commerce demonstrated a reduction in stockouts from 14% to 10.1%, saving $890,000 in excess inventory costs. Even more impressively, forecast generation time dropped from 4 hours to just 12 minutes.
When compared to single-method models, hybrid approaches consistently deliver better results. They can reduce RMSE by as much as 92.9% over ARIMA baselines. In environments with high variability, hybrid models improve accuracy by up to 80% over traditional statistical methods. Even against advanced deep learning models like LSTM, hybrid frameworks show about 70% improved performance.
"A 31% MAPE means your inventory decisions are based on forecasts that are wrong by almost a third on average. For a business running on thin margins, that is the difference between profitability and loss." - Kargin-Utkin, Data & ML Engineering
These improvements in accuracy and efficiency make hybrid forecasting a game-changer for businesses looking to optimize operations and boost profitability.
Getting Expert Help with Implementation
Creating a hybrid forecasting system demands expertise in both statistical techniques and machine learning. If your team lacks the necessary skills, consulting firms that specialize in digital transformation and analytics can simplify the process. To find experienced professionals, check out the Top Consulting Firms Directory (https://allconsultingfirms.com). These experts can guide you through every step, from data preparation and model selection to deployment and monitoring, ensuring your hybrid forecasting system generates measurable results from the start.
Conclusion
Key Takeaways
Hybrid forecasting is reshaping predictive analytics by combining the strengths of different models to deliver more precise and reliable results. This approach not only enhances trend analysis but also addresses the shortcomings of standalone models.
As Daniel Berberich, Data Scientist at inovex GmbH, puts it:
"The fundamental idea is that this combination compensates for the limitations of one approach with the strengths of the other."
Research supports the effectiveness of hybrid models in reducing risks compared to relying on a single forecasting method. Whether you're focused on managing e-commerce inventory, predicting energy demands, or forecasting financial trends, the five-step implementation process - data preparation, statistical baseline development, machine learning integration, forecast combination, and performance optimization - offers a reliable framework for achieving results.
With over 250 research papers on hybrid techniques and numerous success stories highlighting their practical value, it’s clear that hybrid forecasting can drive measurable business outcomes.
These insights serve as a foundation for integrating hybrid forecasting into your operations.
Next Steps
Ready to take the plunge? Implementing hybrid forecasting requires a solid understanding of both statistical methods and machine learning. If you need professional support with model selection, data preparation, or deployment, the Top Consulting Firms Directory (https://allconsultingfirms.com) is a great resource. It connects you with experts who specialize in analytics and digital transformation, helping you tackle challenges and achieve results quickly.
FAQs
When should I use a hybrid forecasting model?
Hybrid forecasting models are a powerful way to boost prediction accuracy by blending the strengths of both statistical and machine learning techniques. These models are especially useful when working with complex time series data, handling multi-scale phenomena, or in cases where single models fall short in precision.
By combining diverse approaches, hybrid models can tackle both linear and nonlinear patterns effectively. They also adapt well to the unique characteristics of your data, making them a solid choice for improving forecast reliability in tough or unpredictable scenarios.
How do I combine a statistical forecast with a machine learning model?
To merge a statistical forecast with a machine learning model, you can take a hybrid approach. Begin with a statistical model like ARIMA to identify and capture linear trends in the data. Then, use a machine learning model such as XGBoost or LSTM to analyze the residuals and uncover any nonlinear patterns that the statistical model might miss.
Another option is to combine the outputs of both models. This can be done through weighted averaging or ensemble methods, which help improve the overall forecast accuracy, especially when dealing with varying time horizons. This blend leverages the strengths of both approaches for more reliable predictions.
Which forecasting metrics work best for real-world demand data?
When it comes to forecasting real-world demand, the best metrics are those that account for non-linear patterns and external influences. This is where hybrid models shine. By blending traditional statistical methods like ARIMA with machine learning techniques such as gradient boosting or neural networks, these models tackle even the most complex demand scenarios. The combination allows for improved predictive accuracy, making use of the strengths from both conventional and cutting-edge approaches.