Managing high-concurrency workloads in data warehouses is all about balancing performance and resource usage. When hundreds of queries run simultaneously, systems like Snowflake, BigQuery, and Redshift face challenges such as queuing, memory limits, and disk spills. Here's a quick breakdown of key strategies to improve efficiency:
- Understand concurrency limits: Platforms like Snowflake (default 8 concurrent queries per warehouse) and BigQuery (dynamic concurrency) have specific caps and scaling methods.
- Optimize queries: Avoid
SELECT *, use partition pruning, and leverage materialized views to reduce resource consumption. - Scale dynamically: Use features like Snowflake’s Multi-Cluster Warehouses or Redshift’s Concurrency Scaling to handle demand spikes.
- Monitor key metrics: Track queued queries, execution times, CPU/memory usage, and disk spill to identify bottlenecks.
- Structure data effectively: Use clustering, sort keys, and compact files to minimize I/O and improve query performance.
Pro tip: Start by testing configurations in staging environments to ensure changes improve performance without unintended side effects. By aligning resource allocation with workload patterns, you can reduce costs and maintain fast query response times.
Let’s dive deeper into these strategies to fine-tune your system for peak performance.
Snowflake Warehouse Optimization | Configure warehouses for maximum performance | Snowflake Tutorial

sbb-itb-97f6a47
What Concurrency Means in Data Warehouses
Concurrency Limits and Scaling Approaches: Snowflake vs BigQuery vs Redshift
Concurrency in a data warehouse is all about handling multiple SQL queries running at the same time on shared computing resources like virtual warehouses or clusters. Imagine it like a busy kitchen where multiple chefs are trying to use the same tools and ingredients - when too many cooks are in the kitchen, things slow down. Similarly, when too many queries compete for resources like CPU, memory, SSD storage, and network bandwidth, performance takes a hit.
The real challenge isn't just about how many queries can run simultaneously. It's about finding a balance between the total number of queries processed and the response time for each query. This becomes especially important for companies that rely on real-time analytics and need to support hundreds of users accessing data at the same time.
"Concurrency in Snowflake is fundamentally different from traditional database management systems. We can achieve great concurrency through the use of multiple virtual warehouses against the same data."
- Sergey Popov, Snowflake Expert
As the number of queries increases, individual queries often take longer to complete because they have to share limited resources. To avoid this, optimizing resource allocation is key to maintaining consistent performance during peak usage.
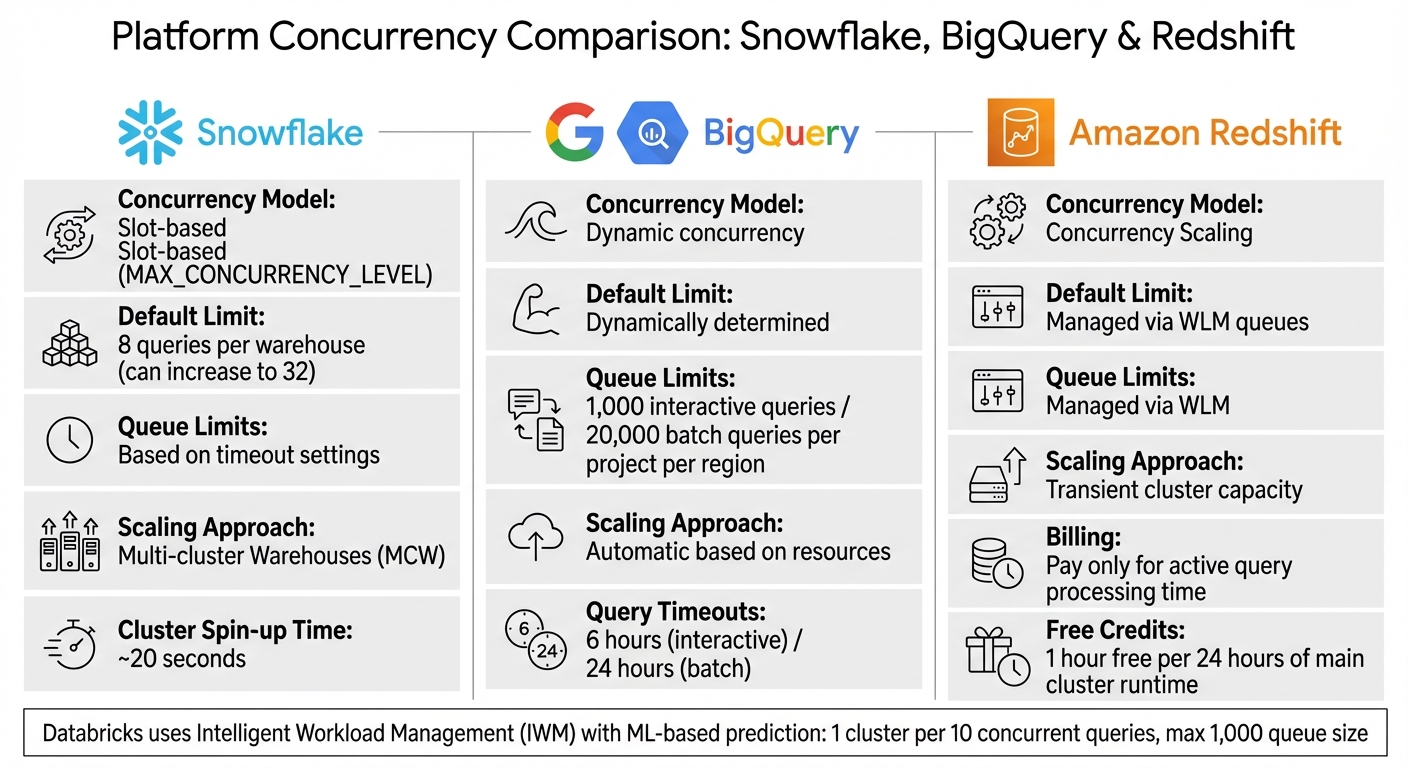
Concurrency Limits in Snowflake, BigQuery, and Redshift

Each platform has its own way of managing concurrency, and understanding these differences is crucial for optimizing performance.
-
Snowflake: Works on a slot-based model with a default
MAX_CONCURRENCY_LEVELof 8 concurrent queries per warehouse, which can be increased to 32. When the limit is reached, additional queries are queued until others finish. During spikes in activity, Snowflake can spin up a new cluster in about 20 seconds. - BigQuery: Takes a dynamic approach, automatically deciding how many queries can run based on available resources rather than using fixed slots. It allows up to 1,000 interactive queries and 20,000 batch queries per project per region. Interactive queries time out after 6 hours, while batch queries have a 24-hour limit.
- Amazon Redshift: Uses Concurrency Scaling to temporarily add extra cluster capacity for both read and write operations. This added capacity is billed only for the time it’s actively processing queries. However, certain features like temporary tables, interleaved sort keys, and Python UDFs aren’t supported in the scaling clusters.
Here’s a quick comparison:
| Platform | Concurrency Model | Default Limit | Queue Limits | Scaling Approach |
|---|---|---|---|---|
| Snowflake | Slot-based (MAX_CONCURRENCY_LEVEL) |
8 queries per warehouse | Based on timeout settings | Multi-cluster Warehouses (MCW) |
| BigQuery | Dynamic concurrency | Dynamically determined | 1,000 interactive / 20,000 batch | Automatic based on resources |
| Redshift | Concurrency Scaling | Managed via WLM queues | Managed via WLM | Transient cluster capacity |
Databricks takes a different approach with Intelligent Workload Management (IWM), using machine learning to predict resource needs and scale dynamically. In Databricks SQL warehouses (Classic and Pro), there’s a limit of one cluster per 10 concurrent queries, with a maximum queue size of 1,000 queries.
How Query Patterns Affect Concurrency
Concurrency isn’t just about platform limits - it’s also influenced by the complexity of your queries. More complex queries consume more resources, which can lead to bottlenecks and slower performance. For example, large aggregations and multi-table joins use up significant memory. When several resource-intensive queries run at once, they can trigger "spilling", where data overflows from memory to disk, causing delays.
Databricks highlights four common bottlenecks that affect concurrency, often referred to as "The 4 S's":
- Storage: Problems with managing many small files.
- Skew: Uneven data distribution.
- Shuffle: Data movement between nodes.
- Spill: Overflow from memory to disk.
For better concurrency, simpler queries like point lookups are more efficient than complex transformations. For instance, Databricks suggests using broadcast joins only for tables smaller than 200 MB, with a hard cap of 1 GB.
"The number of queries executing concurrently on a warehouse cluster has no effect on the number of parallel threads employed by each individual query. These queries will share available physical warehouse resources."
- Sergey Popov, Snowflake Expert
When query spills to disk due to insufficient memory, performance can drop dramatically. To tackle this, monitor spilling metrics and consider increasing warehouse size to add more memory for concurrent execution. For workloads involving large or complex queries, lowering the MAX_CONCURRENCY_LEVEL can help ensure each query gets more resources, reducing retries and improving overall efficiency.
Setting Up Your System for High-Concurrency Workloads
When handling peak traffic, balancing performance and costs requires careful configuration of resource settings, query timeouts, and thorough testing. Here's how you can fine-tune these elements for smoother operations.
Adjusting Concurrency and Resource Settings
The number of queries your system can handle simultaneously depends on how you configure concurrency and resources. For Snowflake, the MAX_CONCURRENCY_LEVEL parameter is key. Simpler queries can benefit from a higher concurrency level, while complex or memory-intensive queries may require lowering it.
"Lowering the concurrency level may boost performance for individual queries, especially large, complex, or multi-statement queries, but these adjustments should be thoroughly tested to ensure they have the desired effect." - Snowflake Documentation
Snowflake also offers multi-cluster warehouses with two scaling policies: Standard, which starts a new cluster immediately when queries queue, and Economy, which delays cluster creation by 15–20 seconds depending on load. Smaller warehouses (X-Small to Medium) can scale up to 300 clusters, while larger ones (6XL) cap at 10.
Amazon Redshift manages concurrency through Workload Management (WLM) queues. Switching to "auto" mode enables Concurrency Scaling, which adds temporary capacity during spikes. For every 24 hours your main cluster runs, you earn an hour of free scaling credits. Costs can be controlled by setting a cap on scaling clusters with the max_concurrency_scaling_clusters parameter.
BigQuery dynamically adjusts concurrency based on available resources. For users with reservations, the target_job_concurrency setting ensures a minimum slot capacity for each query. To optimize performance, separate workloads - for example, route ETL jobs to one queue while running BI dashboards on another - so read-heavy tasks benefit from concurrency scaling.
Setting Query Timeouts and Limits
Once you've optimized resource settings, it's crucial to enforce query timeouts to prevent backlogs. BigQuery defaults to a 6-hour timeout for interactive queries and 24 hours for batch queries. It also limits queue lengths to 1,000 interactive and 20,000 batch queries per region per project.
In Snowflake, the STATEMENT_QUEUED_TIMEOUT_IN_SECONDS parameter cancels queries stuck in the queue for too long. Similarly, BigQuery's default_interactive_query_queue_timeout_ms achieves this goal. You can also set resource thresholds, such as REQUEST_MIN_RESOURCE_GRANT_PERCENT, to ensure each query gets enough resources. Use parameters like max_queue_size to cap queue lengths and reject new requests when capacity is full.
Testing Configurations in Staging Environments
Before making live changes, validate your configurations in a staging environment.
"Insufficient concurrency testing may result in query queuing when multiple users or queries attempt to access the warehouse at once." - Somen Swain, Snowflake Data Superhero
Disable query caching by running:
ALTER SESSION SET USE_CACHED_RESULT=FALSE
This ensures your tests fully utilize compute resources rather than relying on cached results. Use production-like datasets to get accurate performance metrics. Look at concurrency metrics per second to identify short, high-impact traffic spikes.
Experiment with different scenarios to find the right balance. For example, with a single cluster and a default concurrency of 8, a 9th query will queue. Reducing concurrency to 4 may speed up individual queries but will queue the 5th. Compare the "Standard" and "Economy" scaling policies to weigh cost against query responsiveness.
Monitor key metrics such as execution times, queuing durations, parallel query counts, and cluster spin-up times (Snowflake clusters typically take about 20 seconds to become operational after scaling). Use tags like:
ALTER SESSION SET QUERY_TAG = 'urgent_reporting'
to track specific query types causing bottlenecks. Watch for signs like "disk spill" in query profiles, which often indicate memory limits have been exceeded and larger resources are needed. Effective concurrency management and optimized routing can even lower Snowflake costs by up to 30%.
Improving Performance for Concurrent Queries
Once your system is set up to handle high concurrency, the next challenge is speeding up individual queries. When dozens - or even hundreds - of queries hit your data warehouse at once, even small inefficiencies can snowball into major slowdowns. Nawaz Dhandala explains it best:
"A query that takes 30 seconds instead of 3 minutes might not seem like a big deal for a one-off analysis, but when that query runs in a dashboard viewed by 200 people every morning... the difference compounds fast".
Query Optimization Techniques
Start by being selective. In columnar databases like Snowflake, BigQuery, and Redshift, avoid SELECT *. By only pulling the fields you need, you can reduce the data scanned by 90% or more. For instance, if a dashboard only needs customer names and order totals, don’t include unnecessary columns.
Partition pruning is another game-changer. Filtering by date or category in your WHERE clause allows the engine to skip irrelevant data segments, dramatically cutting scan times. Just make sure to reference partition columns directly - wrapping them in functions like DATE_TRUNC() can break pruning.
For frequently used dashboard queries, materialized views can save time by precomputing complex aggregations. Instead of scanning raw data each time, the warehouse serves up pre-processed results. If exact precision isn’t critical, approximate functions like approx_count_distinct can deliver results within 2-3% accuracy while running significantly faster - perfect for trend analysis on massive datasets.
Leverage window functions (e.g., LAG, LEAD, RANK) instead of self-joins to process data more efficiently in a single scan. For example, in Snowflake, using QUALIFY ROW_NUMBER() OVER (...) = 1 to deduplicate data is often faster than relying on DISTINCT during incremental refreshes.
To pinpoint bottlenecks like full table scans or disk spills, use EXPLAIN statements. If queries are spilling to disk, consider upsizing your warehouse to increase memory capacity.
These query tweaks work best when paired with an organized data layout.
Data Layout and Partitioning
The way you structure your data directly impacts query performance. Clustering and sort keys help the warehouse skip over irrelevant data blocks by leveraging "zone maps". In Redshift, use sort keys on columns that are frequently filtered. For Snowflake, monitor clustering depth - keeping it close to 1.0 ensures micro-partitions are well-organized.
Watch out for the small file problem. Scattering data across too many tiny files (under 10 MB) can create I/O bottlenecks due to excessive file opens. Aim for files between 128 MB and 1 GB for analytical workloads, and schedule regular compaction to merge smaller files.
For workloads that involve heavy joins, hash-based partitioning on the join key can prevent costly data shuffling across the network. Ensure partitions are large enough - at least 100 MB - to avoid performance issues caused by too many small splits. Using a power of two (e.g., 2, 4, 8, 16) for the number of partitions helps balance the load and prevents skew.
Platforms like Databricks simplify this process with Liquid Clustering, which automatically adjusts data layouts based on query patterns. This approach handles high-cardinality columns and uneven data distributions more effectively than traditional partitioning.
Once your queries and data layout are optimized, parallel processing can take performance up a notch.
Using Parallel Processing
Parallel processing splits large queries into smaller tasks that run simultaneously. In Snowflake, increasing the size of your virtual warehouse doubles the number of parallel threads and boosts processing capacity. However, keep in mind that concurrent queries share resources, which might slightly increase latency as the system balances the load.
This method works best when CPU usage stays below 30%. For quick queries that only take a few seconds, the overhead of coordinating parallel servers might outweigh the benefits. Save parallel processing for large batch operations or complex queries.
When using parallelism, block range granules often provide better load balancing than partition-based granules. Block range granules divide work at runtime, while partitions limit the degree of parallelism (DOP) to the number of partitions. If you’re using partition-level parallelism, ensure you have at least three times as many partitions as the DOP to distribute the workload evenly.
For large data refreshes, combining parallel INSERT, UPDATE, and DELETE operations with the NOLOGGING clause can speed things up by reducing redo log generation. If your queued queries exceed 10, consider scaling up your warehouse to add memory and prevent disk spills.
Monitoring and Scaling for Changing Workloads
Even with optimized queries and well-organized data, maintaining top performance requires constant vigilance. Workload demands can change throughout the day - think morning dashboard refreshes, end-of-month reporting, or sudden ad-hoc analyses. These spikes can strain your system, making real-time monitoring and adaptive scaling essential to avoid slowdowns and unnecessary costs. By building on earlier query optimization strategies, you can effectively manage these workload fluctuations.
Key Performance Metrics to Track
Tracking the right metrics helps you make smarter scaling decisions:
- Running vs. Queued Queries: A growing queue means it might be time to add more clusters (horizontal scaling). If queries are slow but there’s no queue, increasing cluster size (vertical scaling) could help.
- Query Execution Time and Throughput: Monitor how long queries take and how many are processed per minute. Breaking this data down by query type (short, medium, long) can reveal where bottlenecks exist.
- Disk Spill: Watch for data spilling from memory to disk - it’s a sign that memory resources are stretched thin.
- CPU and Memory Usage: These indicators show how efficiently your clusters are running.
- Scaling Activity: Keep tabs on auto-scaling events and active clusters to ensure scaling mechanisms are working as intended.
- Workload Breakdown: Analyze the time spent on planning, queuing, execution, and result fetching. For example, if fetching times are unusually high, the issue might be oversized result sets or network problems.
- Error Rates: Look for failed, stopped, or timed-out queries. These can signal runaway queries consuming too many resources.
Dynamic Scaling Strategies
When demand spikes, concurrency scaling can temporarily add capacity. For example, Amazon Redshift’s concurrency scaling feature lets you handle these bursts seamlessly. You can enable this by setting the auto mode in Workload Management (WLM) and adjusting the max_concurrency_scaling_clusters parameter. Setting this value between 5 and 10 ensures you’re prepared for larger surges.
AWS highlighted the impact of this feature in August 2024, reporting that increasing the scaling cluster limit to 10 reduced workload completion time from 299 minutes to just 28 - a dramatic improvement.
"Concurrency scaling... automatically adds and removes capacity... to handle demands from thousands of concurrent users, thereby providing consistent SLAs for unpredictable and spiky workloads."
– Harsha Tadiparthi, Principal Solutions Architect, AWS
Serverless platforms like Databricks SQL Serverless and Redshift Serverless take this a step further by using machine learning to predict resource needs. For instance, Databricks’ Intelligent Workload Management (IWM) can analyze incoming queries, queue them if capacity is tight, and dynamically spin up clusters based on wait times. For near-limitless scalability, you can also deploy multiple clusters behind a Network Load Balancer, leveraging data sharing to allow multiple leader nodes to access a single storage layer.
On top of that, Redshift offers one hour of free concurrency scaling credits for every 24 hours your main cluster runs. According to AWS, about 97% of customers meet their scaling needs using these free credits. To stay on top of usage, set up CloudWatch alarms for ConcurrencyScalingSeconds to get notified when you exceed your daily free credit limit.
Error Handling in High-Concurrency Systems
Scaling alone doesn’t solve everything - error handling is just as important, especially during demand spikes. When dozens of queries hit your system at once, a single runaway query can disrupt everything. To avoid this, separate workloads based on priority. For example:
- Route critical, low-latency queries (like executive dashboards) to a dedicated queue with high priority and concurrency scaling enabled.
- Assign background tasks, such as ETL processes, to a different queue to prevent them from hogging resources.
If you notice queues consistently building up, consider increasing the maximum cluster count. Similarly, if query profiles show significant disk spill, upgrading your warehouse size (e.g., from Small to Medium) can provide more memory per node.
To further manage resources, configure warehouse auto-stop settings and query timeouts. This helps prevent idle clusters from racking up costs and terminates runaway queries automatically. For queries that process excessive data due to poor pruning, techniques like Liquid Clustering or Z-ordering can reduce I/O by improving data skipping.
| Bottleneck | Detection Metric | Primary Solution |
|---|---|---|
| Queuing | Peak Queued Queries > 0 | Increase Max Cluster Count (Horizontal Scaling) |
| Spill | Bytes Spilled to Local Storage > 0 | Increase Warehouse Size (Vertical Scaling) |
| Small Files | High Scan Time / Low Pruning | Implement Liquid Clustering / Optimize |
| Shuffle | High Shuffle Time in Query Profile | Use Broadcast Joins for small tables (<200 MB) |
Conclusion
Handling high-concurrency workloads effectively isn’t about simply adding more resources - it’s about understanding your platform’s capabilities and making informed configuration decisions. This guide has outlined key principles, such as recognizing that platforms like Snowflake default to 8 concurrent queries per warehouse cluster, knowing when to scale horizontally or vertically, and understanding how lowering concurrency limits can actually enhance query performance by allocating more memory and CPU to individual tasks.
The foundation of better performance lies in proper system configuration. Tailor your warehouses to match workload patterns, separate essential dashboards from background ETL processes, and set realistic query timeouts to avoid resource bottlenecks. As Sergey Popov from Snowflake puts it, "Understanding concurrency is important for workload management and performance analysis". This understanding directly translates into faster queries and cost efficiency.
Additionally, optimizing queries and organizing data effectively are critical for high performance. Techniques like partitioning and clustering can reduce the amount of scanned data by more than 90%. By keeping an eye on metrics like queued queries, disk spill, and CPU usage, you can identify and resolve bottlenecks before they become a problem.
High performance isn’t something you add later - it’s something you design from the start. Strategies such as adjusting MAX_CONCURRENCY_LEVEL settings and leveraging adaptive scaling provide a solid framework for building a data warehouse capable of handling heavy workloads. Focus on one area, measure the results, and refine your approach to create a system that thrives under pressure.
FAQs
How do I choose between scaling up and scaling out?
To choose between scaling up and scaling out, you’ll need to evaluate your system’s workload and architecture.
- Scaling up means boosting resources like CPU or RAM on your current hardware. This works well for straightforward systems or when growth is steady and predictable.
- Scaling out involves spreading workloads across multiple machines. This approach is better suited for handling high traffic, large datasets, or demand that fluctuates significantly.
When deciding, think about your traffic patterns, the resources your system demands, and your budget constraints. These factors will guide you toward the right option for your needs.
What’s the fastest way to reduce query queuing?
To cut down on query queuing in data warehouses, focus on improving resource management with dynamic scaling and workload management strategies. Tools like auto-scaling (such as Intelligent Workload Management) can allocate extra resources during peak demand, reducing wait times. You can also adjust query concurrency settings and enable transient clusters to handle a higher number of queries at once, ensuring faster responses and better performance during busy periods.
How can I spot and fix disk spill quickly?
To spot disk spill issues, keep an eye on I/O activity and storage usage while queries are running. If you notice high I/O activity, it’s often a sign of disk spills. Pay close attention to I/O per core - if it goes over 3 MB/sec, that’s usually a red flag.
To address this, you can take a few steps:
- Optimize your data layout: Formats like Delta Lake can help.
- Leverage features like Photon: These can improve performance.
- Fine-tune your queries: Aim to cut down on the volume of reads and writes.
Make it a habit to review your storage setup and query patterns regularly to keep disk spills at bay.