Cloud-native applications are now the backbone of modern software, but testing their performance can be tricky. Microservices, containers, and serverless setups demand tools that handle complexity, scale, and dynamic environments. Here's a quick guide to the top performance testing tools for 2025, tailored to cloud-native needs:
- Apache JMeter: Popular, open-source, and flexible with plugins. Great for API testing and integrates well with CI/CD pipelines. Free but may require cloud infrastructure costs.
- k6: JavaScript-based scripting, ideal for developers. Offers a freemium model and seamless cloud integration for distributed tests.
- Gatling: Uses a Scala-based DSL for high concurrency. Open-source but requires technical expertise.
- LoadRunner: Enterprise-grade with multi-language scripting and global scalability. High cost but powerful for large-scale cloud environments.
- NeoLoad: No-code interface with YAML options for DevOps teams. Designed for cloud-native testing with elastic scaling.
- BlazeMeter: Extends JMeter's capabilities with cloud features. Subscription-based, perfect for distributed testing.
- Artillery: Lightweight, YAML-based scripting for APIs and microservices. Open-source with an optional Pro version.
- TestGrid: AI-driven, no-code testing on real devices. Enterprise-focused with cloud-native features.
- Dynatrace: AI-powered monitoring and automated performance analysis. Subscription-based, suitable for complex systems.
- LoadNinja: Browser-based, no-code testing for front-end performance. Commercial plans for scaling tests.
Quick Comparison:
| Tool | Scripting Style | Cloud Integration | CI/CD Ready | Scalability | Pricing |
|---|---|---|---|---|---|
| JMeter | Java-based, GUI | Manual setup | Yes | High | Open-source |
| k6 | JavaScript | Native | Yes | High | Freemium |
| Gatling | Scala-based DSL | Manual setup | Yes | High | Open-source |
| LoadRunner | Multi-language | Native | Yes | Enterprise-scale | Commercial |
| NeoLoad | No-code/YAML | Native | Yes | Auto-scaling | Commercial |
| BlazeMeter | JMeter-compatible | Native | Yes | Enterprise-scale | Subscription |
| Artillery | YAML/JavaScript | Native | Yes | Moderate | Open-source |
| TestGrid | No-code, AI-powered | Native | Yes | Auto-scaling | Commercial |
| Dynatrace | Agent-based, AI-driven | Native | Yes | Enterprise-scale | Subscription |
| LoadNinja | No-code, browser-based | Native | Yes | Cloud-elastic | Commercial |
Each tool has strengths based on your needs - whether it's cost, simplicity, or scalability. Choose based on your team’s expertise, testing goals, and budget.
🚀 Top 5 Performance Testing Tools in 2025: JMeter, LoadRunner, Gatling, K6, Locust
1. Apache JMeter
Apache JMeter has earned its place as one of the most widely used open-source tools for performance testing, with over 60% of performance testers in the US choosing it for cloud-native and API testing tasks. Originally designed for traditional systems, JMeter has evolved to handle the complexities of distributed systems, thanks to its adaptable architecture and extensive plugin library.
Scripting Approach
JMeter offers flexibility when it comes to scripting, catering to both beginners and advanced users. Through its graphical user interface (GUI), testers can visually build test plans by dragging and dropping components - perfect for teams that prefer a code-free workflow. For more advanced needs, JMeter supports Groovy scripting, enabling developers to add custom logic and handle complex scenarios. This dual capability is particularly useful in cloud-native setups, where simulating intricate microservice interactions or managing custom authentication processes is often necessary.
With its rich plugin ecosystem, JMeter further enhances functionality. Plugins can add features like detailed reporting, monitoring, and support for additional protocols, ensuring that teams can tailor their tests to meet specific requirements.
Cloud Integration
JMeter isn’t limited to local environments - it adapts well to cloud setups. Using a master-slave configuration, it can distribute load generation across platforms like AWS, Azure, or Google Cloud. For example, a U.S.-based e-commerce business might deploy JMeter on AWS EC2 instances to simulate thousands of users during peak shopping periods. This approach helps pinpoint bottlenecks and refine server performance ahead of critical events.
CI/CD Compatibility
JMeter fits seamlessly into CI/CD workflows, making it a reliable option for modern development practices. By running performance tests via the command line, teams can integrate JMeter into tools like Jenkins, GitLab CI, or Azure DevOps. This allows automated testing during build and deployment cycles, helping teams catch performance issues early in the process.
Scalability
JMeter’s master-slave architecture makes scaling straightforward. For large-scale tests across multiple geographic regions, managed services like BlazeMeter simplify the process, ensuring smooth orchestration without added complexity.
Pricing Model
As an open-source tool, JMeter itself is free to use. However, costs may arise from cloud infrastructure or premium plugins. Even with these potential expenses, its affordability and powerful features make JMeter a go-to choice for performance testing, consistently ranking among the top tools in the industry.
2. k6
k6 is a performance testing tool designed with developers in mind, especially those working on cloud-native applications. Its JavaScript-based scripting and seamless integration with modern development workflows make it a favorite among teams working with APIs and microservices. In fact, it consistently ranks as one of the top 10 performance testing tools in 2025.
Scripting Approach
One of the standout features of k6 is its use of JavaScript for scripting. Instead of forcing teams to learn proprietary languages, k6 allows developers and QA engineers to write test scripts in a language they likely already know. This makes it easier to create modular and reusable test scenarios, which can handle complex logic. As a result, k6 is particularly effective for testing APIs and microservices in cloud-native environments. This simplicity also makes scaling tests across cloud platforms more straightforward.
Cloud Integration
k6 offers built-in support for cloud-based testing through its managed k6 Cloud service. This feature allows teams to run distributed load tests from various geographic locations without worrying about managing infrastructure. The service provides detailed analytics and dashboards, making it easier to analyze performance data. By integrating seamlessly with development workflows, k6 simplifies performance testing in cloud environments and supports efficient CI/CD pipelines.
CI/CD Compatibility
k6 is built to fit right into modern CI/CD pipelines. It integrates with popular tools like Jenkins, GitHub Actions, GitLab CI, and Azure DevOps, enabling automated performance testing with every code update. This ensures that performance issues are caught early, long before they can affect production.
Scalability
Scalability is another area where k6 excels. It supports both local and distributed test execution. Locally, its event-driven architecture can simulate thousands of virtual users. For larger-scale testing, the k6 Cloud service enables distributed load generation across multiple cloud instances. Additionally, k6 integrates with Grafana, allowing teams to monitor test results in real time and quickly address any performance bottlenecks.
Pricing Model
k6 follows a freemium pricing model, offering flexibility for teams of all sizes. The open-source version is free and perfect for local or self-managed testing. For those needing cloud-based capabilities, subscription plans start at $59 per month, covering up to 10,000 virtual user minutes. Enterprise plans are also available for larger teams with higher testing demands.
3. Gatling
Gatling is an open-source tool designed for performance testing, with a focus on modern web applications and APIs. Its architecture and developer-friendly design make it a great fit for cloud-native setups where high concurrency and quick feedback loops are priorities.
Scripting Approach
Gatling uses a Scala-based DSL (Domain-Specific Language) for writing test scripts. While this might be new territory for some teams, it offers a flexible and concise way to create tests. The tool also includes a scenario recorder that captures real user interactions, making it easier to create realistic load tests. With features like parameterization, it integrates seamlessly into workflows, especially for teams working with microservices. This scripting efficiency lays the groundwork for smooth cloud-based testing.
Cloud Integration
Thanks to its non-blocking architecture, Gatling can generate high loads while using minimal resources, making it perfect for cloud environments. Teams can deploy Gatling on cloud platforms to run distributed load tests across multiple instances, simulating large-scale user traffic without needing extensive on-premises hardware. This setup also supports elastic scaling, allowing tests to adapt to different loads and geographic distributions while keeping infrastructure costs low.
CI/CD Compatibility
Gatling works well with popular CI/CD tools like Jenkins, GitLab CI, and GitHub Actions. This allows teams to automate performance tests as part of their build and deployment pipelines, catching performance issues early in the process. Its real-time reporting feature is particularly useful in DevOps workflows, enabling continuous performance monitoring and validation.
Scalability
Scalability is one of Gatling's strong points. Its event-driven design can handle thousands of concurrent users, making it ideal for large-scale testing scenarios. It supports both single-machine and distributed test executions, allowing teams to spread load generation across multiple cloud instances for bigger tests. To enhance testing visibility, Gatling integrates with monitoring tools like Grafana and Prometheus, providing real-time performance metrics during test runs.
Pricing Model
Gatling operates on a freemium model. The open-source version is free, making it a budget-friendly choice for teams looking to control costs. For those needing advanced features, Gatling Enterprise offers a subscription-based option. This version includes enhanced reporting, distributed testing capabilities, centralized test management, and access to professional support. Pricing depends on the scale of usage and support requirements, but the free version is available right away for teams ready to start testing.
4. LoadRunner
When it comes to enterprise-level performance testing, LoadRunner is a name that stands out. Developed by Micro Focus, this tool caters to organizations that need comprehensive testing capabilities, especially in complex cloud-native environments. While it comes with a premium price tag, it offers powerful features and dedicated support, making it a go-to solution for large-scale testing.
Scripting Approach
One of LoadRunner's key strengths is its flexibility in scripting. It supports multiple programming languages like C, Java, JavaScript, and Python, giving teams the freedom to use the language they’re most comfortable with. This eliminates the need to learn new syntax, which can save time and effort. Additionally, LoadRunner offers protocol-specific scripting, enabling teams to craft realistic test scenarios that closely mimic real-world user behavior. This is especially important when testing intricate microservices or API-heavy applications, which are common in cloud-based systems. With this level of scripting versatility, LoadRunner ensures robust and reliable test setups.
Cloud Integration
LoadRunner sets itself apart with its seamless cloud integration capabilities. The platform works smoothly with major cloud providers like AWS and Azure, allowing organizations to deploy load generators directly in the cloud. This eliminates the need for hefty hardware investments upfront and provides the flexibility to scale resources as needed. Moreover, its distributed testing feature lets teams simulate user traffic from multiple geographic locations. For U.S.-based enterprises serving nationwide customers, this ability to model global traffic patterns is a significant advantage.
CI/CD Compatibility
For teams operating in DevOps environments, LoadRunner's compatibility with CI/CD pipelines is a standout feature. It integrates effortlessly with CI/CD platforms, enabling automated performance testing during the development process. This continuous validation helps detect performance issues early, ensuring smoother deployments and reducing the risk of regressions.
Scalability
LoadRunner shines when it comes to handling large-scale performance testing. Unlike lighter open-source tools, it can simulate traffic from thousands to even millions of virtual users across distributed environments. It also provides real-time monitoring of critical metrics like CPU usage, memory, and network latency, helping teams quickly pinpoint bottlenecks. This level of scalability makes it ideal for applications with fluctuating traffic patterns, a common scenario in cloud-native architectures.
Pricing Model
As an enterprise-oriented solution, LoadRunner follows a commercial pricing model. Costs depend on factors like the number of virtual users, test duration, and additional enterprise features. While it’s more expensive than open-source alternatives, the investment is worthwhile for organizations with complex testing requirements and a need for dedicated support.
For U.S.-based organizations looking to implement LoadRunner, resources like the Top Consulting Firms Directory can connect them with performance testing and cloud migration specialists. These experts can help maximize the tool’s potential while ensuring compliance with local data privacy laws.
5. NeoLoad
NeoLoad, developed by Tricentis, is a performance testing tool designed for enterprise-level DevOps and continuous integration (CI) environments. Its blend of a script-free interface and cloud-based capabilities makes it accessible to both technical and non-technical users, while still delivering robust performance testing for large-scale applications.
Scripting Approach
NeoLoad simplifies performance testing with its drag-and-drop interface, allowing even non-technical users to build tests without writing code. This lowers the barrier to entry compared to traditional tools. For teams that prefer more customization, NeoLoad supports a YAML-based "test-as-code" approach, which integrates smoothly with version control systems and automation workflows. This flexibility allows business analysts to create straightforward tests visually, while DevOps engineers can craft more complex scenarios. Additionally, its RealBrowser technology supports browser-based testing, offering more realistic user simulations.
Cloud Integration
NeoLoad's cloud-native design removes the hassle of managing infrastructure by automatically provisioning load generators in the cloud. This feature enables teams to simulate high user traffic from multiple geographic locations, making it well-suited for applications serving diverse markets, including those across the United States. Its elastic scaling functionality dynamically adjusts resources based on testing needs, eliminating the need for upfront hardware investments. This streamlined cloud integration also makes NeoLoad a natural fit for CI/CD pipelines.
CI/CD Compatibility
NeoLoad integrates seamlessly with popular CI/CD tools like Jenkins, Azure DevOps, and GitLab, enabling automated performance testing within the software delivery pipeline. This helps teams identify performance bottlenecks early in the development cycle. The test-as-code feature ensures performance test configurations are versioned alongside application code, maintaining consistency across various environments and deployment stages. Its ability to scale easily further enhances its utility in demanding, large-scale testing scenarios.
Scalability
With its cloud scaling capabilities, NeoLoad can handle distributed performance tests that replicate real-world traffic patterns. Load generators can be added on demand, allowing organizations to test applications under peak load conditions. The platform supports scenarios ranging from hundreds to thousands of concurrent users and can distribute load across multiple cloud regions. For U.S.-based businesses, this geographic distribution is particularly useful for identifying performance discrepancies caused by different network conditions or server locations.
Pricing Model
NeoLoad offers a custom pricing structure tailored to enterprise needs. Costs are determined by factors like the number of virtual users, test duration, and cloud resources utilized. While this pricing model positions NeoLoad as a premium solution, its extensive features and enterprise-level support often justify the expense. However, the free version has significant limitations, such as restricted features and test durations, making it less practical for small teams or projects with tight budgets. For organizations prioritizing efficient performance testing with minimal scripting, NeoLoad represents a solid investment.
For expert advice on configuring NeoLoad and meeting specific performance requirements, consider consulting specialists through the Top Consulting Firms Directory.
6. BlazeMeter
BlazeMeter, now part of Perforce, stands out as a performance testing platform tailored for large-scale, distributed load testing. Built with a cloud-native design, it’s particularly appealing to enterprises that want to expand their use of Apache JMeter without needing to overhaul their existing investments.
Scripting Approach
One of BlazeMeter’s key strengths is its seamless compatibility with Apache JMeter. Teams can easily import existing JMeter scripts or create new ones using its intuitive GUI or Groovy. Beyond JMeter, the platform supports other open-source formats like Gatling and Selenium, enabling multi-protocol test orchestration. This flexibility allows development teams to stick with their preferred tools while taking advantage of BlazeMeter’s powerful cloud-based infrastructure.
Cloud Integration
BlazeMeter’s cloud-native architecture eliminates the need for on-premises infrastructure by automatically provisioning cloud resources. This setup enables teams to simulate thousands of concurrent users across multiple regions, providing a clear picture of global traffic patterns. Real-time monitoring during tests ensures teams can track key performance metrics and make adjustments as needed.
CI/CD Compatibility
BlazeMeter integrates effortlessly with popular CI/CD tools like Jenkins, Bamboo, TeamCity, and GitHub Actions. With its REST APIs and specialized plugins, teams can automate test execution directly within their build pipelines. This aligns perfectly with shift-left testing practices, helping developers catch performance issues early in the development cycle.
Scalability
The platform is designed to handle large-scale testing scenarios, thanks to its cloud-based infrastructure. It can dynamically scale to support tens of thousands of virtual users across various cloud regions. For instance, a U.S. retailer successfully simulated Black Friday traffic with over 50,000 virtual users across North America, leveraging BlazeMeter through a Jenkins CI/CD pipeline to prepare for peak demand.
Pricing Model
BlazeMeter follows a subscription-based pricing structure, with plans that adjust based on the number of virtual users, test duration, and additional features. Enterprise plans offer options like dedicated support, enhanced security, and compliance tools. While free trials or limited-use tiers might be available for initial evaluation, full-scale enterprise testing typically requires a paid subscription. For businesses, the combination of JMeter compatibility and cloud scalability makes BlazeMeter a strong contender for enterprise-level performance testing.
If your organization needs expert assistance with BlazeMeter or cloud-native testing strategies, the Top Consulting Firms Directory is a helpful resource for connecting with IT and digital transformation specialists.
sbb-itb-97f6a47
7. Artillery
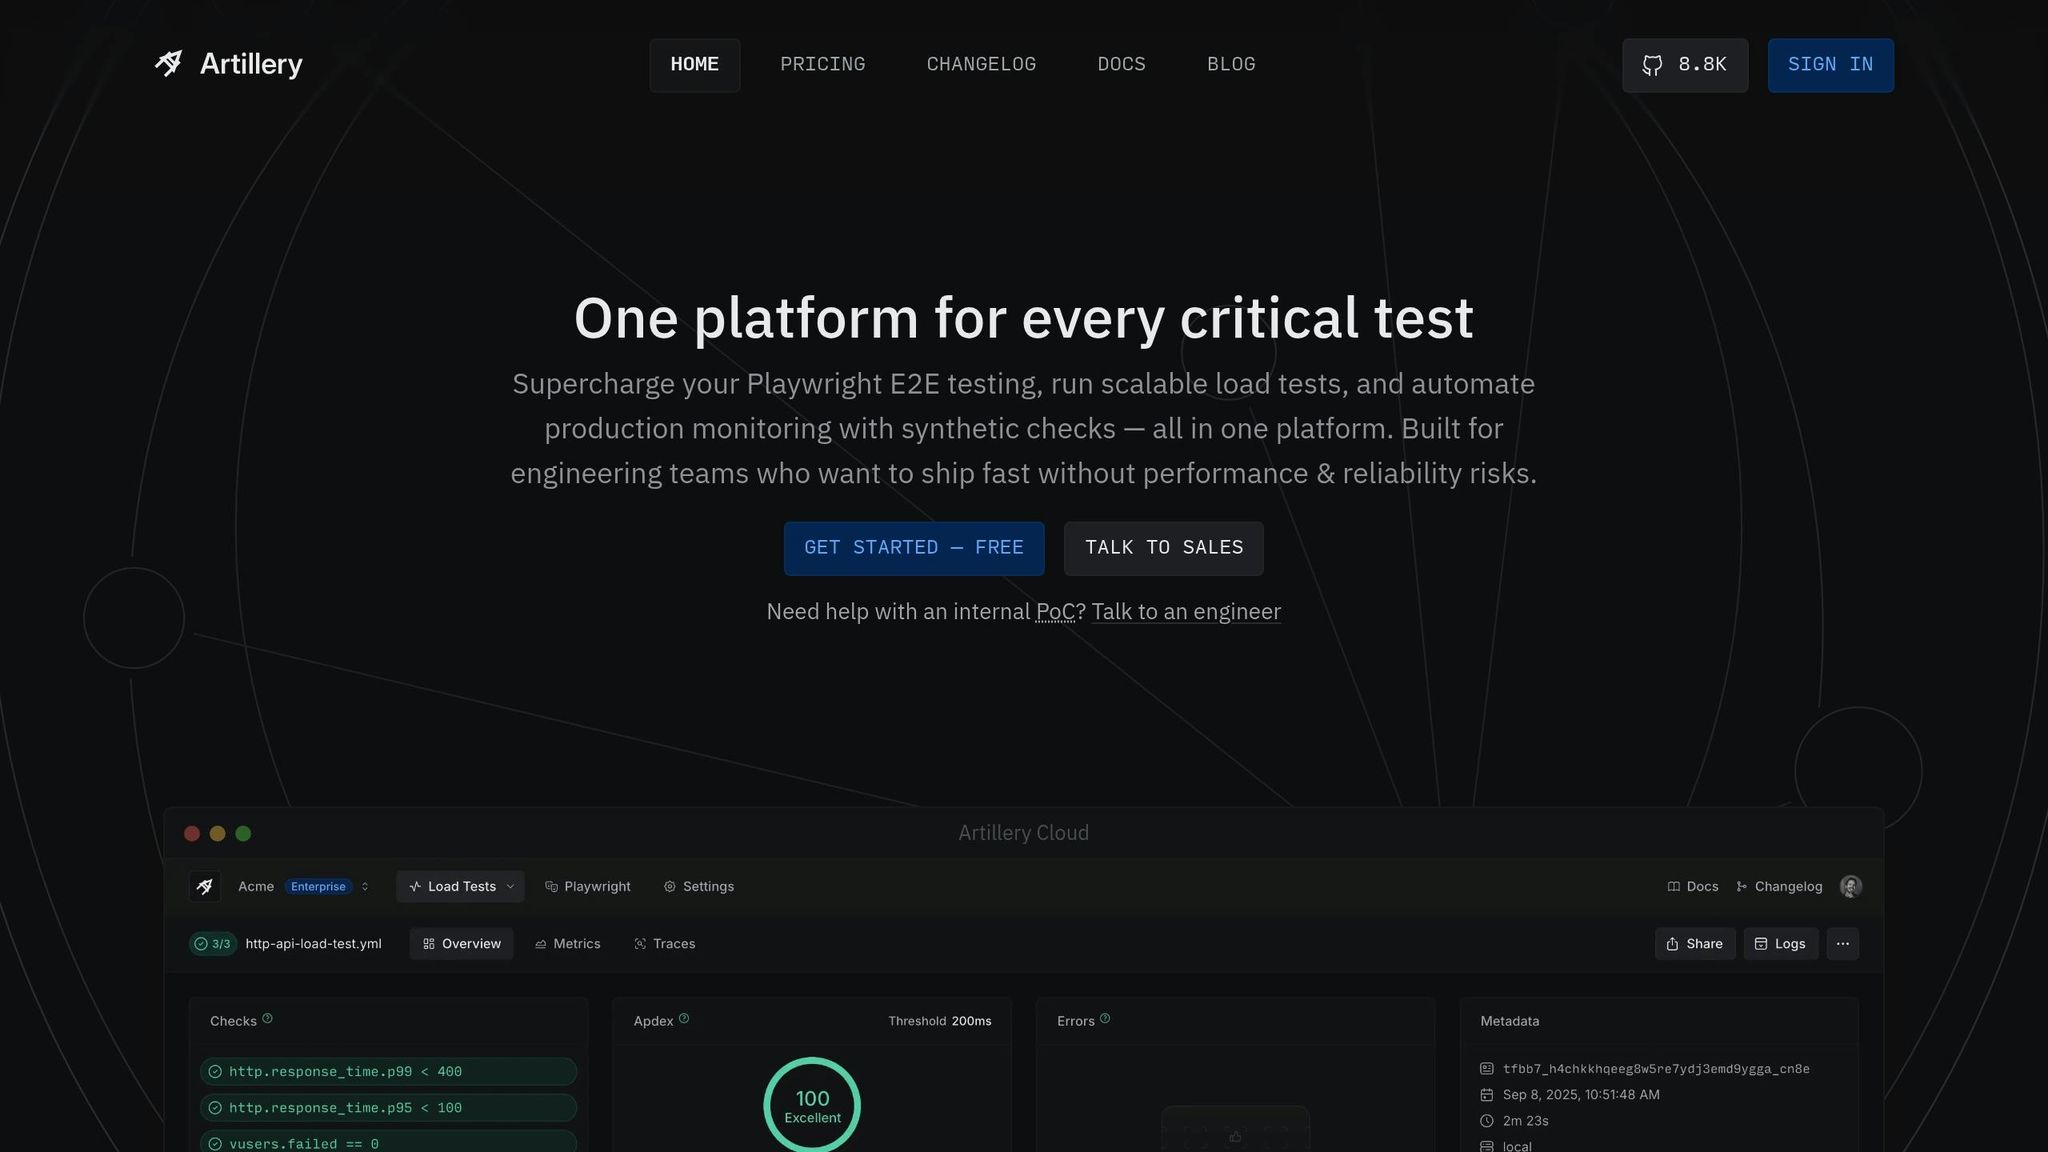
Artillery is an open-source performance testing tool built on Node.js, designed to evaluate APIs, microservices, and web applications in cloud-native setups. Its scriptable, developer-friendly approach makes it a strong choice for teams working with distributed systems.
Scripting Approach
Artillery uses a YAML-based format for scripting, allowing developers to create test scenarios in a straightforward, readable way. For more advanced needs, it supports JavaScript extensions, enabling custom logic while keeping things simple. This setup makes it easy to manage test scripts alongside application code using version control and seamlessly integrate them into existing workflows. Plus, its scripting capabilities pair effortlessly with its cloud features.
Cloud Integration
Through its managed service, Artillery Cloud, the tool supports distributed load testing on platforms like AWS and Google Cloud. By generating user traffic from multiple regions simultaneously, teams can evaluate global application performance without the hassle of managing their own infrastructure.
CI/CD Compatibility
Artillery integrates smoothly with CI/CD pipelines, thanks to its CLI tools and plugins for platforms such as GitHub Actions, GitLab CI, and Jenkins. This integration automates performance testing with every code change, helping teams identify potential performance bottlenecks early in the development cycle.
Scalability
Artillery is designed to scale horizontally, whether across multiple machines or cloud instances, simulating anywhere from thousands to millions of virtual users. This flexibility allows teams to start small with local tests and scale up as their applications and performance demands grow.
Pricing Model
Artillery offers a free open-source version, making it accessible for startups and smaller teams with basic performance testing needs. For organizations requiring advanced features like distributed cloud load testing and detailed reporting, Artillery Pro provides enterprise-level capabilities through a usage-based pricing structure.
For additional support, check out the Top Consulting Firms Directory.
8. TestGrid
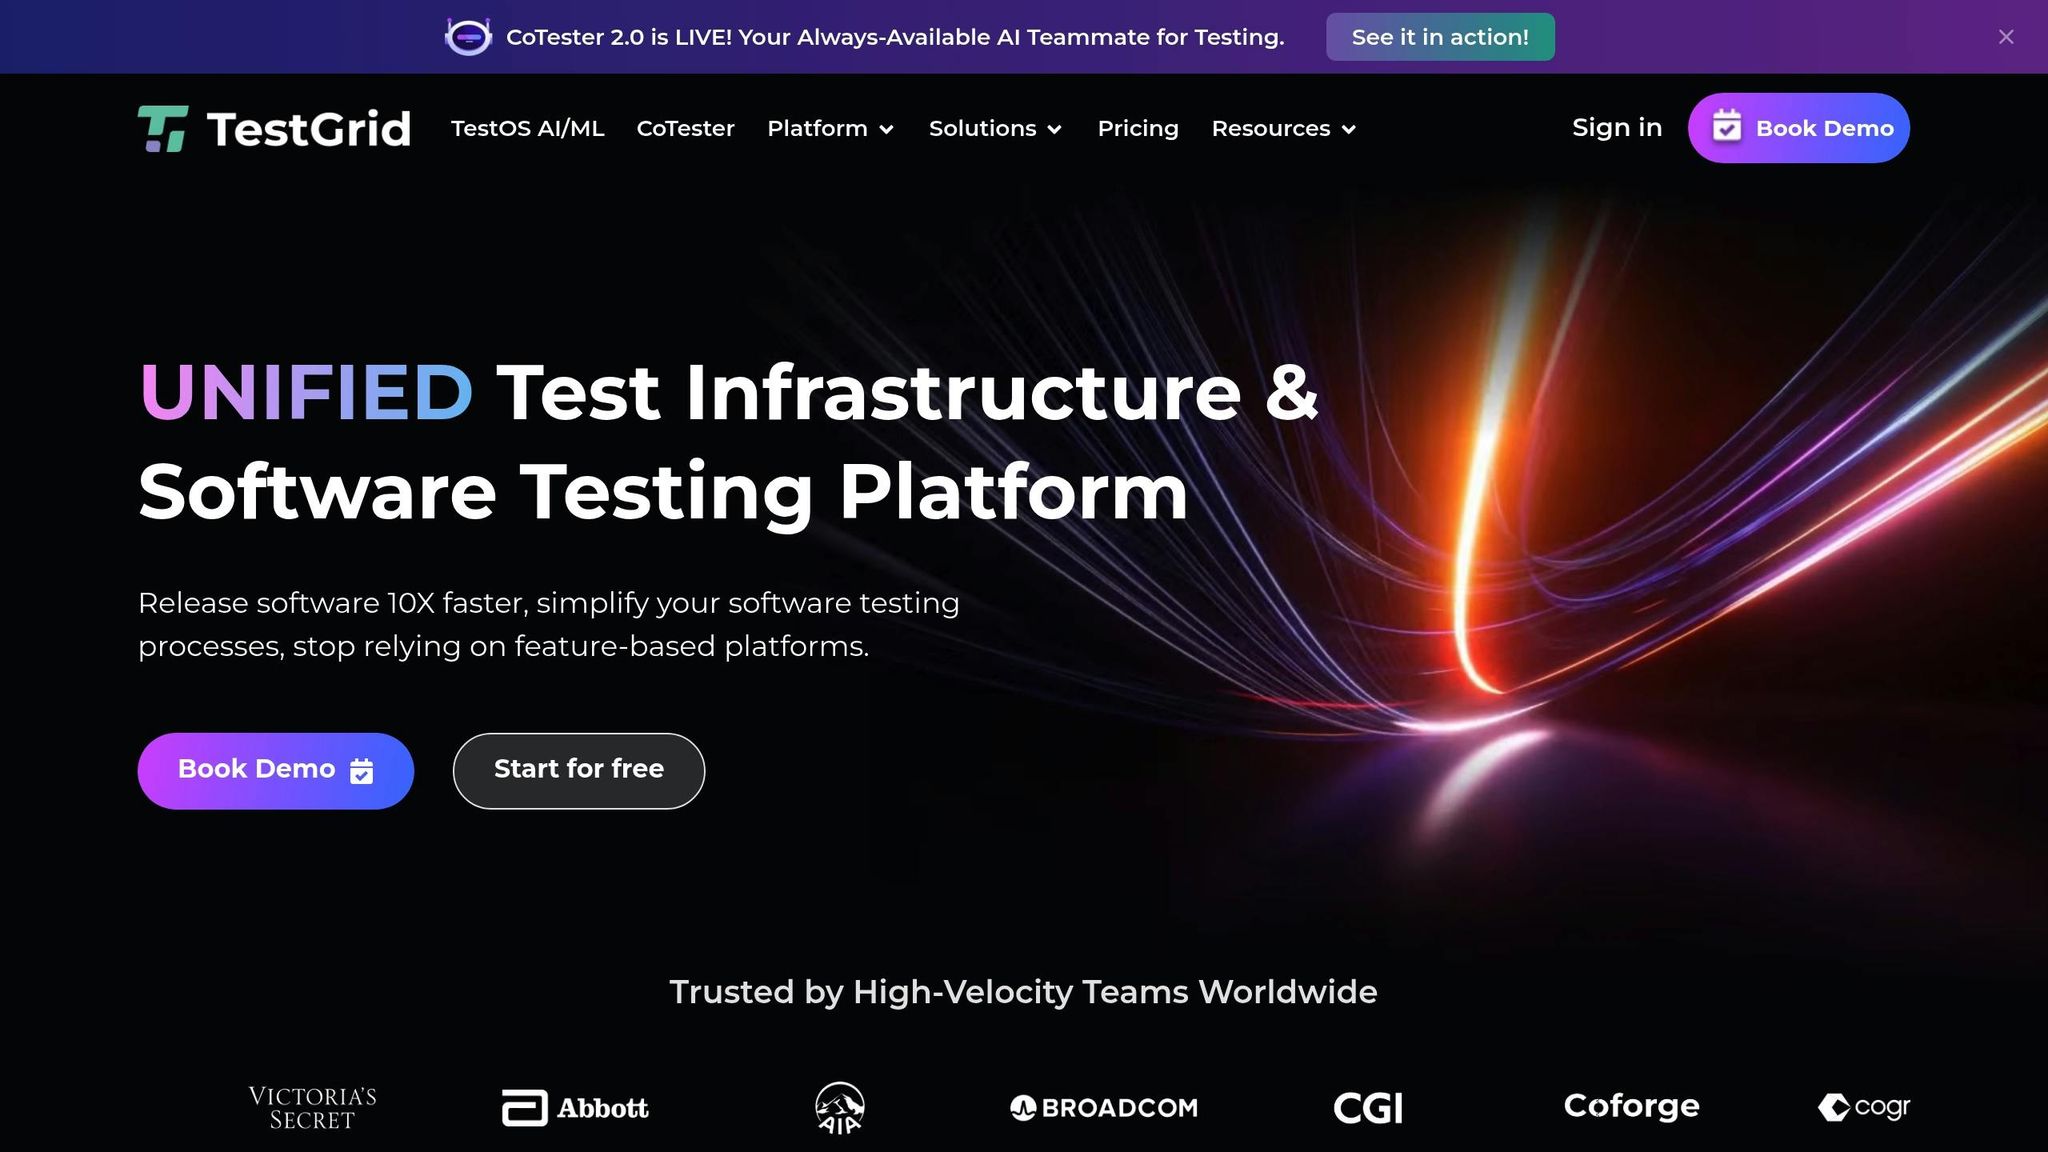
TestGrid is an AI-driven, no-code platform designed for thorough, cloud-native performance testing of web, mobile, and API applications on actual devices and browsers. Unlike tools that rely on simulated setups, TestGrid runs tests on real hardware, delivering performance metrics that closely align with real-world user interactions. Let’s dive into some of its standout features, including its scripting approach, cloud capabilities, CI/CD integration, scalability, and pricing structure.
Scripting Approach
With its no-code interface, TestGrid makes test creation and automation accessible to everyone - whether you're a seasoned developer or someone with no technical background. This user-friendly approach reduces the need for complex programming, allowing QA professionals, business analysts, and developers to collaborate seamlessly. The result? A shorter learning curve and a more inclusive testing process.
Cloud Integration
TestGrid is built with cloud-native environments in mind. It integrates smoothly with cloud infrastructure, enabling distributed load testing and real-device testing at scale. By leveraging cloud resources, teams can simulate traffic from different regions and devices, ensuring applications perform well under a variety of conditions. Plus, since there's no need to manage on-premise infrastructure, teams can focus entirely on optimizing performance.
CI/CD Compatibility
The platform works seamlessly with popular CI/CD tools, making it easy to embed performance testing into your build and deployment pipelines. This integration supports shift-left testing practices, offering early feedback and helping teams catch performance issues before they make it to production. Automated alerts notify teams of regressions, improving response times and enabling faster, high-quality releases.
Scalability
TestGrid is designed to grow with your needs. It can run parallel tests across multiple real devices and browsers in the cloud, handling everything from basic load tests to complex stress tests for large-scale applications. Whether you're testing for a small user base or preparing for peak traffic events, TestGrid's scalable infrastructure ensures your applications are ready for the challenge.
Pricing Model
As an enterprise-focused solution, TestGrid offers features like real-device testing, AI-powered analytics, and deep CI/CD integration. While exact pricing details aren't publicly available, the platform typically uses a tiered or customized pricing model based on factors like usage, device access, and support requirements. Organizations can work with TestGrid to create a pricing plan that aligns with their specific testing needs and scale.
9. Dynatrace
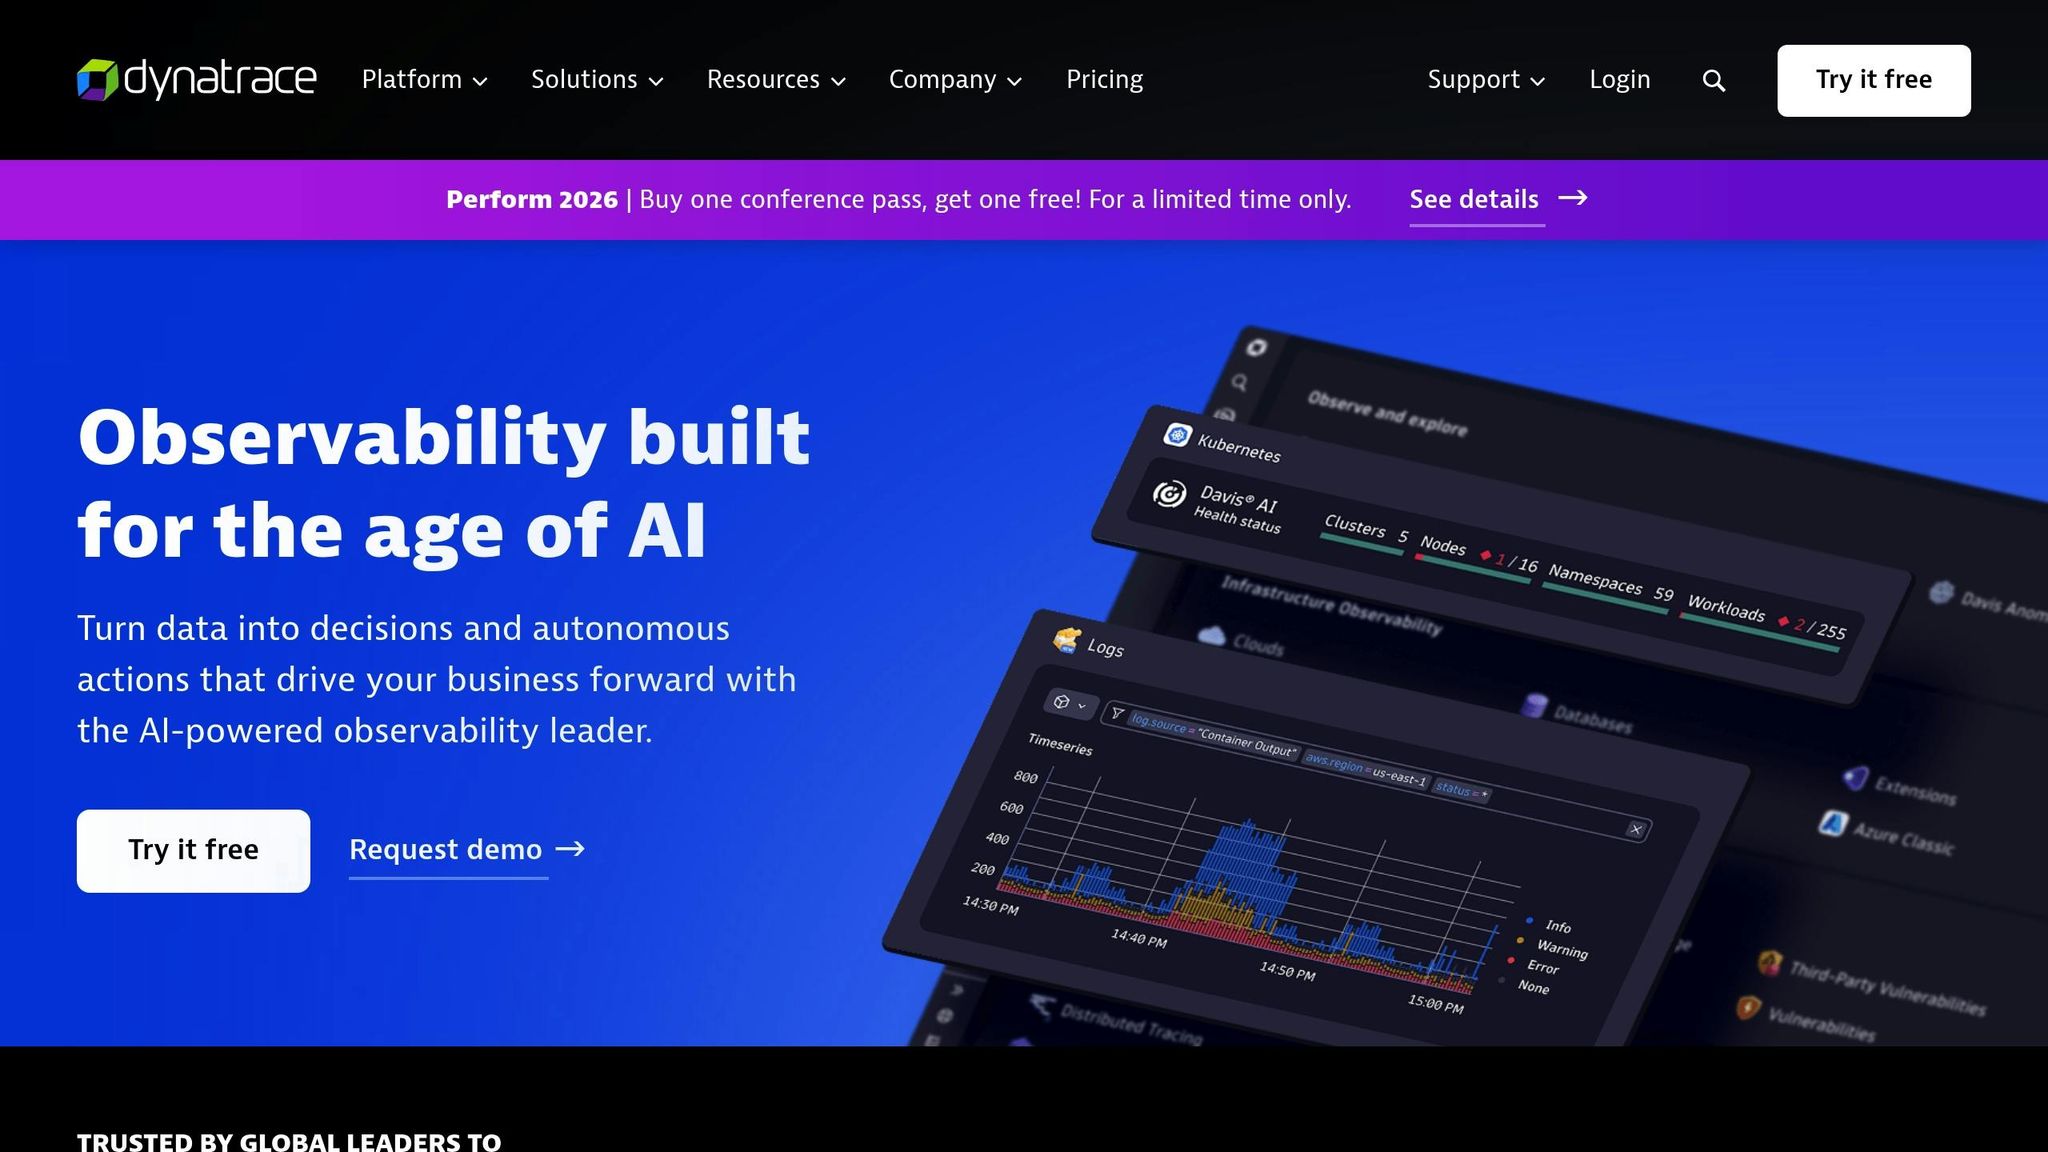
Dynatrace is a monitoring platform designed for complex, distributed systems. It combines AI-powered insights with full-stack monitoring to deliver real-time analytics and continuous performance tracking. This makes it particularly suited for organizations working with intricate microservices architectures. The platform simplifies application monitoring by automatically identifying and addressing performance bottlenecks.
Scripting Approach
Dynatrace takes a different approach compared to traditional performance testing tools. Instead of relying on manual, time-consuming scripting, it uses an agent-based monitoring system. This eliminates the need for extensive scripting, reducing maintenance efforts. Its AI-driven engine automatically detects performance issues and provides root cause analysis, saving teams significant time and effort.
Cloud Integration
Dynatrace seamlessly extends its capabilities to cloud environments. It integrates natively with major cloud providers like AWS, Microsoft Azure, and Google Cloud Platform. The platform automatically discovers cloud resources and monitors services such as Kubernetes clusters, serverless functions, and managed databases. This unified visibility across hybrid and multi-cloud setups is especially beneficial for organizations managing complex cloud architectures.
CI/CD Compatibility
The platform works hand-in-hand with popular CI/CD tools like Jenkins, GitLab CI, and Azure DevOps. By integrating performance testing and quality checks directly into deployment pipelines, Dynatrace supports automated workflows and shift-left testing practices. Teams can use APIs and plugins to ensure that only applications meeting performance standards are deployed, catching issues early in the development cycle.
Scalability
Dynatrace is built to handle large-scale environments with ease. Its cloud-native architecture supports horizontal scaling, enabling monitoring of thousands of hosts, containers, and services simultaneously. With features like auto-scaling and distributed data collection, it maintains performance even in high-throughput scenarios. It’s no surprise that over 60% of Fortune 500 companies rely on Dynatrace for their monitoring needs.
Pricing Model
Dynatrace operates on a subscription-based pricing model, starting at approximately $21 per month per host for full-stack monitoring as of October 2025. Pricing varies depending on factors like deployment size, custom metrics, and additional features. Enterprise customers can also request tailored packages to suit their specific requirements.
For organizations looking to maximize their investment in Dynatrace, expert guidance can be invaluable. Resources like the Top Consulting Firms Directory can help businesses connect with consulting firms specializing in IT and digital transformation, ensuring successful implementation and optimal use of the platform.
10. LoadNinja
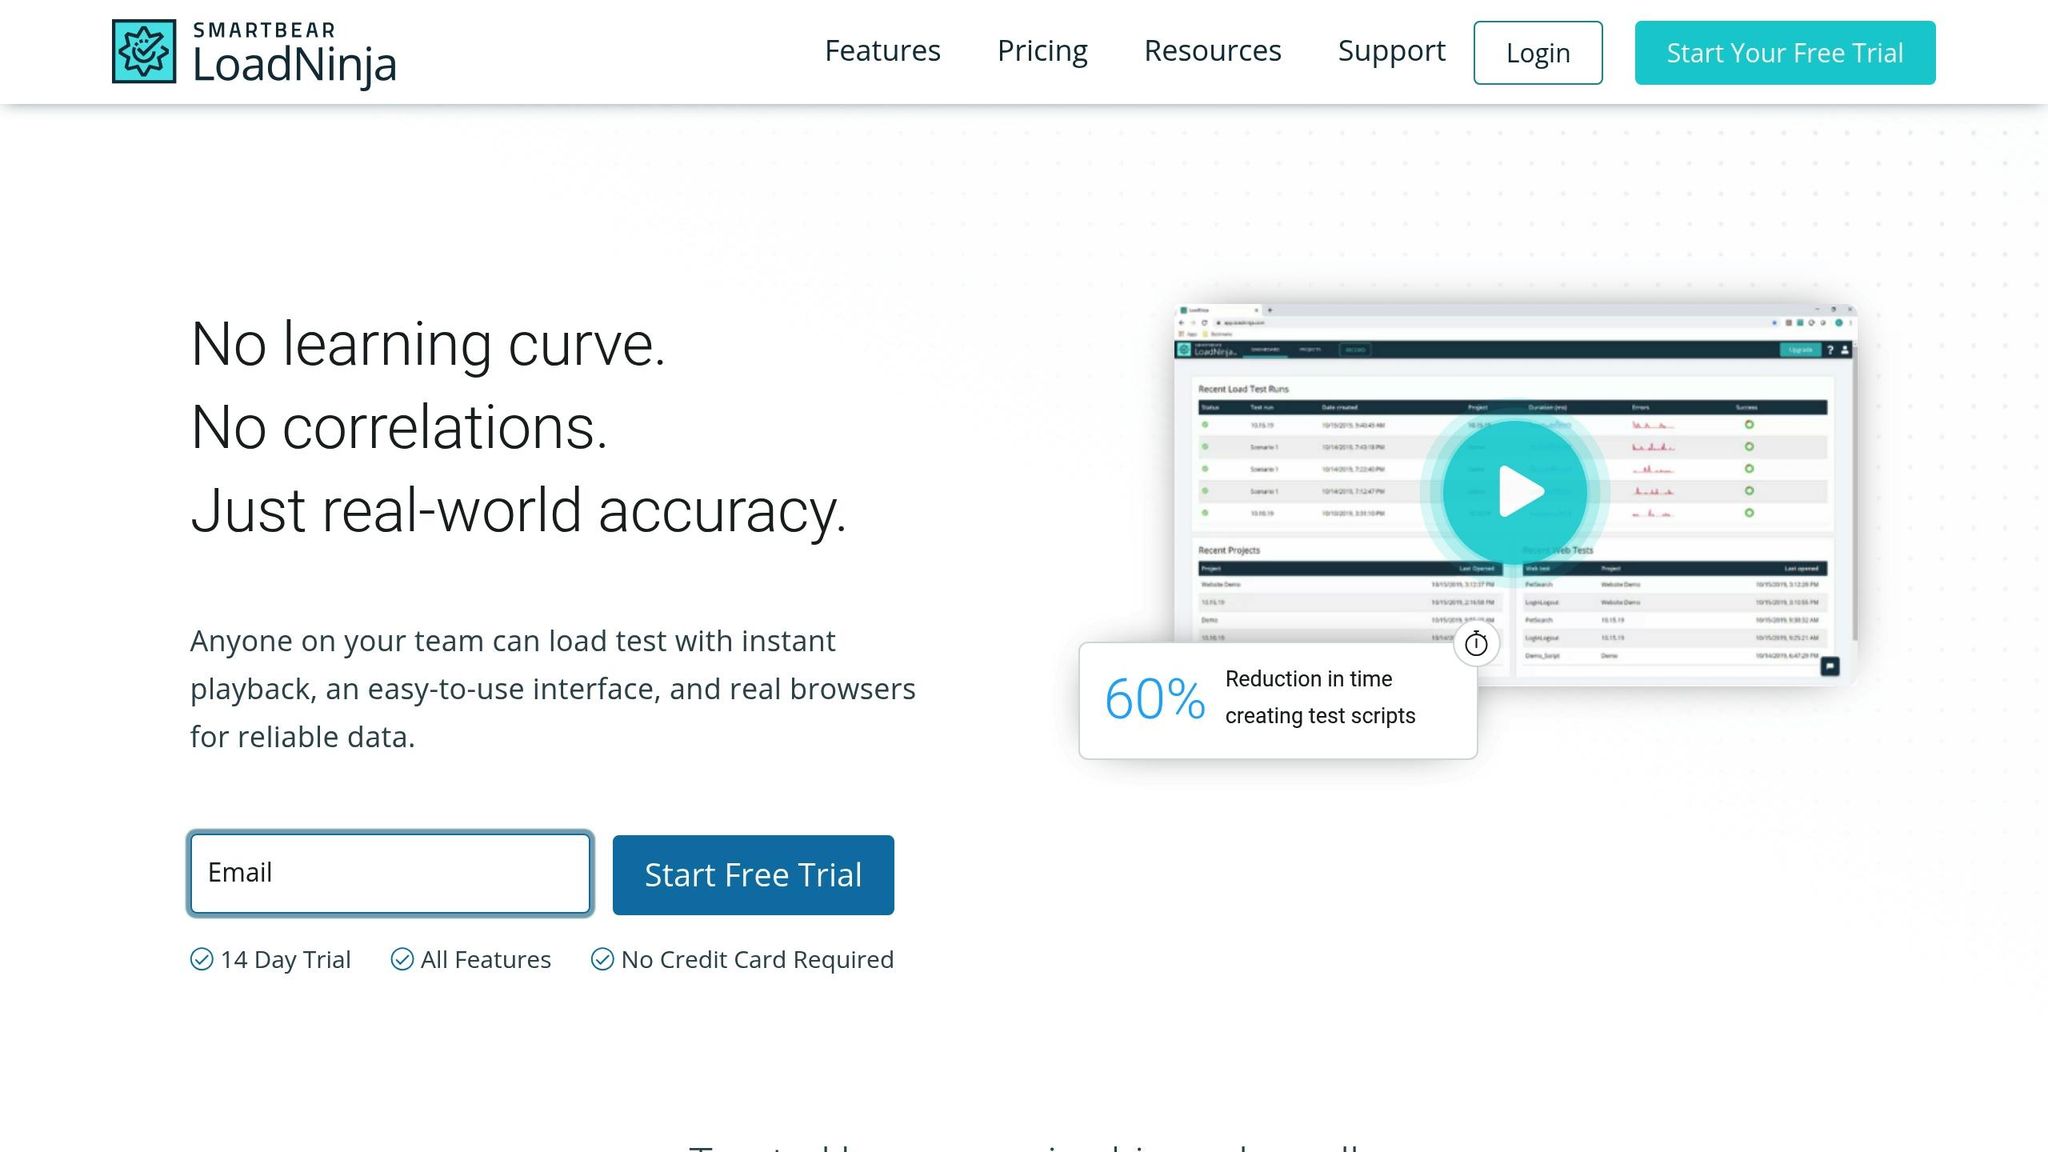
LoadNinja focuses on testing with real browsers rather than relying on simulations. This cloud-based platform allows teams to create and run load tests using actual browsers, providing detailed insights into how web applications perform under stress. It's especially useful for organizations that prioritize front-end performance and user experience.
Scripting Approach
LoadNinja takes a no-code, browser-based approach to testing. Instead of requiring manual coding, it records actual browser interactions, making it accessible even for testers without programming skills. This feature allows teams to capture real user workflows and automatically generate test scenarios, which is particularly helpful for testing complex web applications with dynamic content and JavaScript-heavy elements. This straightforward method makes large-scale testing more manageable and efficient.
Cloud Integration
Being a cloud-native tool, LoadNinja handles everything - test execution, scaling, and result analysis - in the cloud. This eliminates the need for local infrastructure. Its architecture allows teams to scale on demand, simulating thousands of virtual users from different geographic locations to create realistic load scenarios. This setup also supports distributed testing and collaboration among teams spread across various locations, all while using real browser environments for accurate performance insights.
CI/CD Compatibility
LoadNinja integrates smoothly into CI/CD workflows through REST APIs and plugins for tools like Jenkins, GitHub Actions, and Azure DevOps. This integration enables teams to automate performance tests as part of their build and deployment pipelines, ensuring continuous validation of application performance and quicker feedback during development.
Scalability
Thanks to its cloud-based design, LoadNinja can dynamically scale to simulate thousands of concurrent users across multiple regions with no manual setup or hardware requirements. This makes it an excellent choice for enterprise-level testing scenarios.
Pricing Model
LoadNinja uses a subscription-based pricing model, with tiers based on virtual user hours, concurrent tests, and available features. Plans are available for small teams, mid-sized companies, and large enterprises, with pricing typically in U.S. dollars. Organizations can choose between monthly or annual billing, and custom pricing options are available for high-volume or specialized needs, allowing flexibility to match specific testing goals.
For businesses looking to get the most out of LoadNinja - especially those with limited expertise or complex cloud-based systems - consulting services can be a smart investment. The Top Consulting Firms Directory is a valuable resource for finding experts in performance engineering and digital transformation to help design and optimize LoadNinja testing strategies.
Tool Comparison
Selecting the right performance testing tool depends on factors like your team’s technical expertise, infrastructure requirements, and budget. Each tool impacts testing strategies and efficiency in its own way. Below, we break down key differences in scripting, cloud integration, scalability, and pricing.
When tackling cloud-native performance testing challenges, scripting is a critical consideration. Apache JMeter uses Java-based scripting with a graphical interface, making it familiar to developers in the Java ecosystem. k6, on the other hand, is built on JavaScript, appealing to full-stack developers working with modern web technologies. Gatling employs a concise Scala-based DSL, offering powerful customization but requiring more advanced technical knowledge. Meanwhile, TestGrid and LoadNinja take a no-code approach - TestGrid uses AI-powered design, while LoadNinja provides a browser-based interface - making them accessible to QA teams and business analysts with little to no coding experience.
Cloud integration is another crucial factor. Tools like k6, BlazeMeter, and NeoLoad feature native cloud architectures, automatically provisioning and scaling resources to reduce operational overhead. In contrast, tools such as JMeter and Gatling can run in cloud environments but often require manual setup and additional services for optimal performance.
For enterprise environments, scalability often dictates tool choice. BlazeMeter and LoadRunner are built for large-scale, distributed testing, capable of supporting thousands of virtual users across global locations - ideal for multinational companies. On the other hand, k6 and Artillery excel in microservices testing, efficiently handling APIs at scale with minimal resource demands. Tools like NeoLoad and TestGrid offer automatic scaling, making them perfect for dynamic workloads common in modern applications.
Pricing models vary significantly across tools. Open-source options like JMeter, Gatling, and Artillery eliminate licensing costs, making them attractive to startups and mid-sized businesses. Freemium models, such as k6, provide free tiers with paid upgrade options, catering to agile teams. Enterprise solutions like NeoLoad, LoadRunner, and Dynatrace use custom pricing structures designed to meet the compliance and support needs of larger organizations.
Table: Comparative Analysis of Cloud-Native Performance Testing Tools
| Tool | Scripting | Cloud Setup | CI/CD Compatibility | Scalability | Pricing Model |
|---|---|---|---|---|---|
| Apache JMeter | Java-based with GUI | Compatible | Yes | High | Open-source |
| k6 | JavaScript-based | Native | Yes | High | Freemium |
| Gatling | Scala-based DSL | Compatible | Yes | High | Open-source |
| LoadRunner | Advanced scripting | Native | Yes | Enterprise-scale | Enterprise |
| NeoLoad | Scriptless drag-and-drop | Native | Yes (built for DevOps) | Auto-scaling | Enterprise |
| BlazeMeter | JMeter-compatible | Native | Yes | Enterprise-scale | Enterprise |
| Artillery | YAML-based | Compatible | Yes | Moderate | Open-source |
| TestGrid | No-code, AI-powered | Native | Yes | Auto-scaling | Enterprise |
| Dynatrace | AI-powered | Native | Yes | Enterprise-scale | Enterprise |
| LoadNinja | No-code browser-based | Native | Yes | Cloud-elastic | Commercial |
Some tools stand out for their real-browser testing capabilities. TestGrid, LoadNinja, Dynatrace, NeoLoad, and LoadRunner allow testing on actual browsers and devices, providing accurate front-end performance insights that are essential for user experience validation. In contrast, tools like JMeter, k6, Gatling, Artillery, and BlazeMeter rely on simulated browsers. While effective for API and backend testing, these tools may not capture browser-specific performance issues.
Finally, the learning curve and community support are important considerations. JMeter benefits from extensive documentation and a large user base, making it easier for new users to get started. Tools like Gatling, which use specialized languages, may require more expertise but offer greater flexibility for advanced users. No-code platforms simplify adoption for non-technical team members, though they may lack the flexibility needed for highly complex testing scenarios.
Conclusion
Choosing the right cloud-native performance tool comes down to balancing your team's skills, budget, and specific requirements.
For teams with skilled developers and limited budgets, open-source options like Apache JMeter, k6, Gatling, and Artillery are excellent. These tools provide flexibility and avoid licensing fees but do require scripting knowledge. JMeter stands out for its rich plugin ecosystem, while k6’s JavaScript-based approach appeals to modern web development teams.
When focusing on API and microservices testing, lightweight and efficient tools are key. k6 and Artillery shine here with their straightforward scripting and detailed metrics. Gatling’s asynchronous architecture also makes it a strong choice for handling high-concurrency API testing, a common need in cloud-native setups.
For teams with limited coding expertise, no-code platforms like TestGrid and LoadNinja simplify the process. These tools offer user-friendly interfaces and real-browser testing, making them accessible to QA teams and business analysts who aren’t familiar with scripting.
Enterprise-level organizations tackling large-scale testing often turn to BlazeMeter and LoadRunner. These tools provide advanced features like cloud-based load generation and real-time analytics across global locations. However, their cost may be a barrier for smaller teams. Starting with open-source tools for proof-of-concept testing can be a practical way to validate strategies before committing to premium solutions.
For DevOps teams prioritizing CI/CD integration, tools like NeoLoad, Gatling, k6, and TestGrid ensure performance testing fits seamlessly into development pipelines. This helps catch performance issues early, saving time and resources in the long run.
Cloud-native environments require tools that can handle distributed architectures and dynamic traffic patterns. For organizations unsure about their strategy, consulting experts can provide clarity. The Top Consulting Firms Directory is a valuable resource for finding tailored recommendations based on your unique needs.
Lastly, the rise of AI-driven analytics and cloud-native scalability is reshaping the performance testing landscape. Tools with these capabilities allow teams to quickly pinpoint bottlenecks and improve performance without needing heavy infrastructure investments. As applications grow more complex and distributed, selecting tools that can adapt to your evolving needs is more crucial than ever.
FAQs
What should I look for when selecting a cloud-native performance testing tool for my business?
When selecting a cloud-native performance testing tool, it's essential to weigh a few key factors. Start by assessing scalability - can the tool handle dynamic, distributed environments as your needs grow? Next, consider how easily it integrates with your existing CI/CD pipelines. A smooth integration process saves time and ensures efficiency. Also, don't overlook cost-effectiveness - the solution should fit within your budget without compromising quality.
It's equally important to check if the tool supports containerized applications and works well with platforms like Kubernetes. Customizable testing scenarios are another plus, allowing you to tailor tests to your specific requirements. Ultimately, choose a tool that aligns with your team's technical needs and financial constraints, ensuring it delivers value over the long haul.
Why is it important for cloud-native performance testing tools to integrate with CI/CD pipelines, and how does this integration work?
Integrating cloud-native performance testing tools into CI/CD pipelines plays a key role in maintaining application reliability and scalability, especially in fast-moving development cycles. This setup ensures performance tests run automatically during the build and deployment stages, allowing teams to catch bottlenecks and issues early on.
By embedding performance testing into the CI/CD workflow, teams can benefit from continuous feedback, minimize the chances of performance failures reaching production, and uphold strong application quality. These tools often connect via APIs, plugins, or scripts, making it simple to execute tests alongside other automated tasks.
What are the benefits of using AI-powered analytics in cloud-native performance testing tools?
AI-driven analytics in cloud-native performance testing tools bring a host of advantages to the table. For starters, they can pinpoint performance bottlenecks in real time by processing massive amounts of test data. This means teams can troubleshoot and fine-tune systems much faster. On top of that, AI algorithms excel at spotting patterns in historical test results, predicting potential failures or slowdowns before they become a problem for users.
These tools also take care of repetitive tasks like spotting anomalies and generating reports, saving both time and effort while boosting accuracy. By integrating AI, businesses can ensure their cloud-native applications stay dependable, even when dealing with heavy traffic or intricate challenges.