API workload performance testing ensures your API can handle high traffic and heavy loads while maintaining speed and reliability. Automating this process saves time, improves consistency, and integrates seamlessly into modern development workflows. Here's what you need to know:
- Why Automate? Manual testing can't scale to simulate thousands of users or complex traffic patterns. Automation provides consistent results and catches issues early in CI/CD pipelines.
- Business Impact: Slow APIs hurt revenue and user experience. For example, Amazon found that a 100ms delay costs 1% in sales.
- Preparation: Use a realistic testing environment, dynamic data, and baseline metrics to ensure accurate results.
- Tools: Popular tools include Grafana k6, Apache JMeter, Postman, and Locust, each with unique strengths for different needs.
- Execution: Structure test plans around performance goals, simulate real workloads, and monitor tools to identify bottlenecks.
- Optimization: Focus on key metrics like P95 latency and error rates. Address issues like database inefficiencies and connection pool limits.
- Integration: Automate tests in CI/CD pipelines with smoke, load, and stress tests to catch regressions early.
Automating API performance testing ensures your systems stay reliable under pressure, reducing downtime and improving user satisfaction.
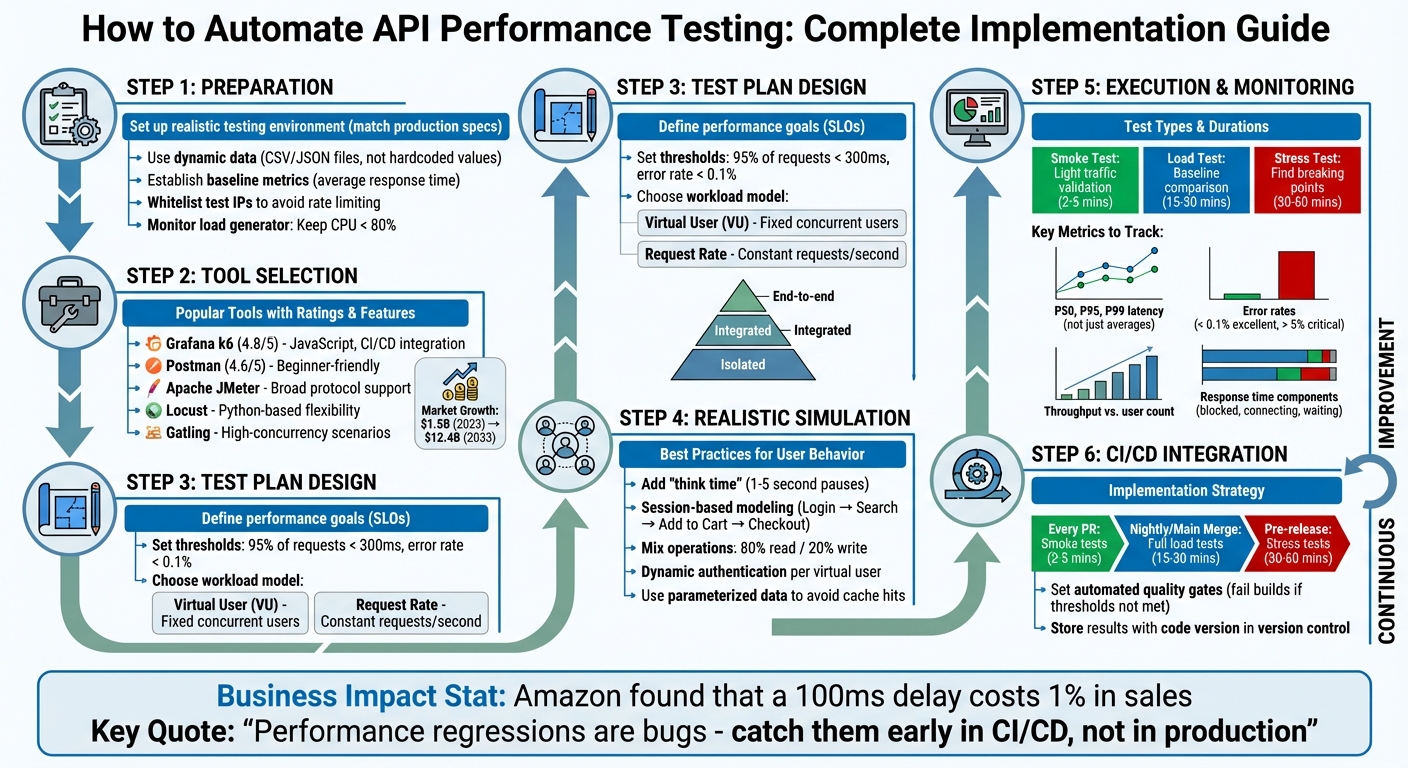
API Performance Testing Automation Workflow: 6-Step Implementation Guide
Preparing for Automated API Performance Testing
Setting Up a Realistic Testing Environment
To get the most accurate results, your testing environment should closely resemble your production setup. This includes aligning hardware specifications, software versions, network configurations, and even autoscaling parameters. Using a dedicated staging or development environment is a safer choice than running tests in production, as it avoids potential disruptions or data contamination.
Keep a close eye on your load generator's capacity to avoid bottlenecks. Ensure CPU usage stays below 80%, monitor network bandwidth, and deploy load generators in regions that match your user base to simulate realistic latency.
When testing, use dynamic data from sources like CSV or JSON files instead of hardcoding values. Static data can lead to false positives by allowing your API's caching layer to hide underlying performance issues. If your API interacts with external services, such as payment gateways or third-party APIs, consider using mocks or virtualized dependencies. This approach isolates your tests and prevents them from affecting real external systems. Additionally, set up your environment to handle dynamic token generation and refresh logic to simulate multiple unique user sessions effectively.
To avoid interference from rate limiters, whitelist your test IPs. Also, implement a data cleanup strategy, such as using database snapshots or cleanup scripts, to maintain a consistent testing environment.
Establishing Baseline Metrics
A performance baseline serves as a benchmark for how your API performs under normal workload conditions. It’s a critical reference point for evaluating whether changes improve or degrade performance. Start by focusing on a primary metric, like average response time, to make comparisons straightforward over time.
Run your tests long enough to reach a stable state - often referred to as a warm-up period - to ensure that initial system startup activities don’t skew the results. Your test scenarios should reflect real user behavior, incorporating varied user journeys rather than repeatedly targeting a single endpoint. Avoid using static tokens or IDs, as these can lead to misleading results due to caching. Instead, use dynamic variables or external data files to simulate diverse user actions.
"A performance baseline is more than just a set of numbers; it's a historical contract with your users." - GoReplay
Revisit and update your baselines after major changes, such as new releases, migrations, or schema updates. Store these baseline reports alongside the corresponding code version in version control to track performance trends over time. For added efficiency, integrate lightweight baseline checks into your CI/CD pipeline. This helps catch issues like a 5% increase in response time before they reach production.
Once your baseline metrics are solid, you can set up monitoring tools to track performance under load.
Configuring Monitoring Tools
With a realistic environment and established baselines, monitoring becomes the backbone of your performance testing strategy. Effective monitoring requires insights into both the client side (load generator) and the server side (system under test). Popular tools for load generation include Grafana k6, Postman Collection Runner, Apache JMeter, and LoadRunner. For storing and visualizing time-series metrics, tools like Prometheus, InfluxDB, and Grafana are widely used.
Define pass/fail criteria in your test scripts using tools like k6 thresholds. This allows your CI/CD pipeline to automatically fail builds if performance targets aren’t met. Configure your tools to output results in machine-readable formats like JSON or CSV, making it easier to automate regression comparisons between builds. For dynamic endpoints (e.g., "/api/posts/1"), use URL grouping to avoid overwhelming your reports with excessive metrics.
Synchronize test timestamps with server-side observability data, such as database slow-query logs, garbage collection traces, and connection pool usage. This helps identify the root causes of latency spikes. Keep an eye on your load generator for signs of strain, such as spikes in http_req_blocked or dropped_iterations, which indicate hardware limits have been reached. Lastly, include sleep() functions in your scripts to simulate realistic "think time" between requests. This not only prevents overloading your load generator but also better mimics actual user behavior.
sbb-itb-97f6a47
Choosing the Right Tools for Automation
Popular Tools for API Workload Testing
When selecting a tool for API workload testing, it's essential to match it with your team's skillset, project scale, and technical requirements. Apache JMeter is a go-to choice thanks to its broad protocol support, including REST, SOAP, GraphQL, gRPC, and Kafka. However, its Java-based GUI can be challenging to master, especially for beginners. On the other hand, Grafana k6, with a stellar 4.8/5 rating on G2, is developer-friendly, offering JavaScript scripting and seamless CI/CD integration. One standout feature is its ability to define pass/fail thresholds directly in the test scripts - like setting a p95 latency limit of 300ms.
For teams new to performance testing or those with minimal coding experience, Postman (rated 4.6/5 on G2) is a solid option. That said, its ability to handle large-scale loads can be constrained by the resources of the local machine. Gatling, with its support for Scala or Java and detailed HTML reporting, excels in high-concurrency scenarios. Python-centric teams may prefer Locust for its flexibility in creating custom workflows, while Artillery leverages YAML to handle modern API protocols, including WebSockets and GraphQL.
"Load testing is not about breaking your system - it is about understanding its limits before your users discover them." - Nawaz Dhandala
When evaluating tools, focus on three key factors:
- Scalability: Ensure the tool can simulate thousands of concurrent users.
- Protocol Support: Check if it covers the API types you use.
- Observability Integration: Look for compatibility with platforms like Grafana, Prometheus, or Datadog for exporting metrics.
The API testing market is expected to grow significantly, from $1.5 billion in 2023 to $12.4 billion by 2033.
Installation and Initial Setup
Once you've chosen your tool, the next step is installation and basic setup to ensure it integrates smoothly with your API. Most tools offer simple installation processes. For example:
- k6: Install via package managers like Homebrew on macOS (
brew install k6), Chocolatey on Windows (choco install k6), or APT on Linux (sudo apt install k6). Docker users can pull the image withdocker pull grafana/k6. - Postman: Download the desktop app, as its performance testing features aren't available in the web version.
After installation, start with a basic smoke test to confirm your API is responding correctly before diving into full-scale stress tests. For k6, this involves creating a simple JavaScript test file to send a few requests. In Postman, begin by selecting a collection, navigating to the Performance tab in the Collection Runner, and running a small number of virtual users (VUs) for a short time.
To enhance testing realism, k6 supports features like SharedArray for loading CSV or JSON data once for all virtual users. Adding randomized sleep intervals between requests can mimic typical user behavior. Use environment variables (e.g., k6 run -e BASE_URL=https://api.example.com) to avoid hardcoding API endpoints.
Set performance thresholds early on - such as requiring 95% of requests to complete in under 300ms. This way, k6 can exit with a non-zero status code if the threshold isn't met. Additionally, configure ramping stages to gradually increase the load, simulating real-world traffic patterns effectively.
Performance testing your API with Grafana K6⚡
Designing and Executing Automated Test Plans
Once you've selected your tools and set up the testing environment, the next step is creating a focused test plan.
Structuring Your Test Plan
Start by defining clear performance goals and success metrics. Are you testing for reliability under normal conditions, or do you want to discover the system's limits during traffic spikes? Using Service Level Objectives (SLOs) can help you set measurable pass/fail thresholds directly in your test scripts. For instance, you might decide that 95% of requests should complete in under 300ms with an error rate below 0.1%.
Follow the testing pyramid approach for a structured process:
- Begin with isolated API endpoints to establish baseline performance.
- Move to integrated APIs to see how services interact.
- Finally, test end-to-end flows that mimic real user behavior.
This step-by-step approach makes it easier to pinpoint bottlenecks. Use your baseline data and monitoring tools to set realistic thresholds and SLOs. Pay special attention to high-traffic routes or resource-heavy operations like complex database queries, authentication, and search or filter endpoints to identify potential performance issues.
Next, decide on a workload model. Two common options are:
- Virtual User (VU) modeling: Simulates a fixed number of concurrent users performing tasks. Ideal for stress testing.
- Request Rate modeling: Maintains a constant number of requests per second. Better for validating SLAs and throughput targets.
Choose the model that aligns with the performance goals you identified during baseline testing.
Simulating Realistic Workload Scenarios
Effective testing means simulating real-world user behavior, not just sending machine-speed requests. Add "think time" - pauses between actions - to avoid creating unrealistic concurrency. You can introduce randomized delays of 1–5 seconds or use a normal distribution to mimic typical user behavior.
For even more realistic scenarios, use session-based modeling. This method simulates complete user journeys instead of isolated endpoint interactions. For example, in an e-commerce test, you might simulate a flow like Login → Search → Add to Cart → Checkout. This approach helps you uncover bottlenecks caused by dependencies between system components that single-endpoint tests might miss. Ensure each virtual user handles its own authentication lifecycle, including fetching and refreshing tokens, rather than relying on a shared static token.
Data parameterization is another key technique. Avoid hardcoding values, as this can lead to unrealistic cache hit rates that hide performance issues. Instead, use dynamic data from CSV or JSON files. Tools like k6's SharedArray can load data once and share it across virtual users. Additionally, mix read and write operations to reflect actual usage patterns - an 80% read to 20% write ratio is a common example.
| Executor Type | Best For | Load Control |
|---|---|---|
| Constant VUs | Baseline performance | Fixed number of concurrent users |
| Ramping VUs | Finding breaking points | Gradually increasing user count |
| Constant Arrival Rate | SLA/Throughput validation | Fixed number of requests per second |
| Ramping Arrival Rate | Spike/Auto-scaling tests | Changing request rate over time |
Executing Automated Tests
Start with a simple smoke test to ensure everything is functioning correctly. This step helps you catch configuration errors early and confirms that your API responds as expected under light traffic. Gradually increase the load to uncover the system's limits.
Keep an eye on the load generator's performance. If its CPU usage exceeds 80%, the results may become skewed. For arrival-rate executors, pre-allocate virtual users to prevent "cold start" issues where the load generator struggles to meet the target rate.
Use checks to validate individual responses, such as status codes, headers, and payload content. While these checks confirm correctness at a granular level, thresholds at the test level determine whether the system meets overall performance goals. For example, group dynamic endpoint URLs like "/api/products/123" into a single metric (e.g., "/api/products/[id]") to keep your data organized and actionable.
"Always confirm the load generator is not the bottleneck before blaming the SUT (System Under Test)." - Beefed.ai
Finally, integrate these automated tests into your CI/CD pipeline to catch performance issues early in the development process.
Analyzing Performance Results and Optimizing APIs
Interpreting Key Performance Metrics
Once automated test plans are in place, the next step is to dig into the metrics and fine-tune API performance. Relying on average response times can be misleading since a few slow requests can skew the data and fail to represent the majority of user experiences. Instead, focus on percentiles: the median (P50) reflects what most users experience, while P95 and P99 reveal the "tail latency" that affects the slowest 5% or 1% of users. As LoadForge puts it, "A single response time number is almost meaningless without context. What matters is how response times are distributed across all requests".
Look out for the "hockey stick" pattern in response time charts. This pattern - a sudden jump from a flat line to a steep incline - signals that your system has hit its capacity limit. Ideally, throughput should increase proportionally as more users join. If throughput levels off while user numbers continue to rise, the system has likely maxed out. Error rates are another critical metric: rates below 0.1% are excellent, but anything above 5% indicates significant strain. Break errors into categories: 4xx errors often point to problems in test scripts, while 5xx errors suggest server-side issues.
To pinpoint bottlenecks, break down response times into smaller components like blocked, connecting, and waiting times. For example, high http_req_blocked times could mean the connection pool needs expansion, while elevated http_req_waiting times might indicate slow backend processing. These granular insights can guide you toward the root cause of performance issues.
Identifying and Resolving Bottlenecks
Correlating metrics across different layers of your system is key to diagnosing performance problems. For example, overlaying response time and error rate charts with user counts can help pinpoint the moment when performance begins to degrade. If you notice that P99 latency increases but CPU usage stays low and error rates remain stable, the issue could be connection pool exhaustion. In such cases, increasing the pool size - say, from 50 to 200 connections - might resolve the problem. Alternatively, if latency spikes line up with token refresh intervals, your authentication server could be the bottleneck.
It’s also crucial to ensure the load generator itself isn’t the limiting factor, as previously discussed. On the backend, eliminate inefficient database patterns like N+1 queries by batching database calls, which can significantly cut down latency. Netflix, for instance, improved API performance by 70% by shifting to edge computing microservices. Tools like Prefix or Scalene can help identify specific functions that are consuming too much time or memory. Once fixes are implemented, retest to confirm the improvements.
After addressing bottlenecks, it’s essential to clearly document the performance results for future reference and communication.
Documenting and Communicating Results
Establish clear Service Level Objectives (SLOs) to make performance goals straightforward for stakeholders. For example, an SLO might state that 95% of requests should complete within 500ms. Integrate these performance tests into your CI/CD pipeline, using non-zero exit codes to automatically flag builds that fail to meet these benchmarks.
When presenting results, translate technical metrics into business terms. For instance, explain how a 2-second delay in latency could lead to abandoned transactions or lost revenue. With the API testing market projected to grow from $1.5 billion in 2023 to $12.4 billion by 2033, having detailed and actionable performance documentation is more important than ever. Maintain a performance baseline dashboard to monitor key metrics over time and across software releases. This approach ensures stakeholders can easily track progress and identify trends.
Incorporating Automation into CI/CD Pipelines
Setting Up Automated Tests in CI/CD
Performance testing shouldn't be left as a last-minute QA task. Instead, it should move to the pull request stage. Automating these tests within your CI/CD pipeline ensures every code change gets validated, helping you catch potential issues before they hit production. Use your existing performance baselines to set clear quality gates in the pipeline, and adopt a layered testing approach to balance thoroughness with development speed.
Here’s how to structure your testing:
- Smoke load tests: Run these lightweight tests on every pull request. They take about 2–5 minutes and use minimal virtual users to catch obvious issues.
- Full load tests: Conduct these during nightly runs or after merging to the main branch. These tests, lasting 15–30 minutes, simulate realistic traffic to detect more subtle problems.
- Stress and spike tests: Before major releases, run these for 30–60 minutes to identify breaking points and ensure the system can handle sudden traffic surges.
Quality gates are essential for enforcing performance standards. These gates use specific pass/fail criteria based on Service Level Objectives (SLOs). For example, if an API’s p95 response time exceeds 500 ms or error rates go above 1%, the pipeline can block the merge or deployment automatically. As LoadForge puts it:
"A load test that requires someone to manually read a report and decide whether things look 'okay' is not a gate - it is a suggestion".
Modern API testing platforms offer CLI tools that integrate seamlessly with systems like GitHub Actions, GitLab CI, Jenkins, and Azure DevOps. Use headless execution modes for CI/CD workflows, and store sensitive data like API keys as CI/CD secrets, injecting them as environment variables during runtime. To further optimize, cache the testing tool binaries to avoid downloading them repeatedly during each job execution.
| Test Type | Trigger Frequency | Duration | Primary Goal |
|---|---|---|---|
| Smoke Load | Every Pull Request | 2–5 mins | Identify obvious regressions and script errors |
| Average Load | Nightly / Main Merge | 15–30 mins | Compare against performance baselines |
| Stress Test | Pre-release / Scheduled | 30–60 mins | Find breaking points and scalability limits |
By embedding these tests into your CI/CD pipeline, you can get immediate feedback on performance changes.
Detecting Performance Regressions Early
Automated deployment is just the start. Early detection of performance issues in CI/CD is critical to preventing costly regressions in production. Manual testing often delays detection, leading to more incidents in live environments. Automating performance tests at the pull request stage allows you to catch issues within minutes of a code change, rather than after they’ve gone live.
Adopt a "performance ratchet" strategy: start with thresholds based on your current performance baseline and tighten them incrementally as the application improves. Tools like k6 can be configured to immediately abort tests (abortOnFail: true) if performance metrics fall below critical thresholds, saving CI resources.
"Performance regressions are bugs, and like all bugs, they are cheapest to fix when caught early." - LoadForge
To complement this, run synthetic monitoring in production. These read-only smoke tests, executed every 15–30 minutes, can uncover environment-specific issues that might only appear under real-world conditions. When a quality gate fails, correlate test results with system metrics like CPU usage, memory consumption, or SQL slow query logs to identify the root cause. Don’t ignore intermittent failures either - they could point to hidden issues like race conditions or garbage collection pauses, which require deeper investigation.
Conclusion
Key Takeaways
Automated API performance testing plays a crucial role in ensuring business success. Poorly performing APIs can harm both revenue and user experience, which makes early detection of issues absolutely necessary.
To make automation effective, start with clear performance requirements that guide your testing strategy. Focus on critical endpoints - like login flows, search features, and payment systems - rather than trying to test everything at once. Create realistic scenarios that mimic actual user behavior, such as including think times and dynamic data, to avoid skewed results caused by artificial caching.
Integrating tests into your CI/CD pipeline helps catch regressions early, eliminating the need for constant manual oversight. Lightweight smoke tests can run on every pull request to catch basic issues, while more intensive stress tests should be scheduled for nightly runs or pre-release checks. Automated pass/fail gates tied to performance budgets ensure that no regressions go unnoticed.
Next Steps for Implementation
To get started with automated testing, focus on a single critical API endpoint. Begin by creating a baseline test with 100 iterations. This will serve as your reference point for assessing future performance changes. Use realistic environment setups and baseline data to ensure accurate results. Once the initial setup is solid, gradually expand to include additional endpoints and more complex user scenarios.
Always test in an environment that closely mirrors your production setup. Scaled-down environments often produce misleading results. Your testing infrastructure, database size, and configurations should reflect the actual conditions your users experience. Keep an eye on both client-side metrics like latency and server-side metrics like CPU usage to pinpoint bottlenecks.
For organizations dealing with complex enterprise environments or needing specialized expertise, the Top Consulting Firms Directory is a valuable resource. It connects businesses with leading consulting firms that specialize in IT infrastructure, digital transformation, and strategic management. These experts can help design tailored testing frameworks aligned with your architecture and business objectives.
FAQs
What’s the best way to set a performance baseline for my API?
To establish a solid starting point for your API's performance, conduct controlled tests focusing on critical metrics such as response times, throughput, and error rates. These initial measurements serve as benchmarks for future evaluations, making it easier to spot any regressions or emerging issues. Setting this baseline early ensures your API maintains steady performance and helps catch problems before they affect production.
How do I make load tests realistic with dynamic data and tokens?
To make your load tests more realistic, incorporate dynamic data and tokens into your test scripts. This means using variable or generated data, like names or addresses, instead of static inputs. Tools with built-in data libraries can help create this dynamic information on the fly. Additionally, extract and reuse tokens during the test flow to ensure that each virtual user operates with a unique and valid token. This method better mirrors real user behavior and prevents static data from distorting your results.
Which metrics should I gate on in CI/CD (p95, p99, error rate)?
When setting up metrics in CI/CD pipelines for API performance testing, it's crucial to monitor latency percentiles like p95 and p99, along with error rates. These metrics are essential for spotting performance regressions. Latency percentiles, such as p95 and p99, provide insights into worst-case response times, which are vital for ensuring a good user experience. Meanwhile, error rates track system stability under load, helping to identify issues that could disrupt functionality.